Reading and Transcribing Sounds
Musical scores are a precise set of actions: play this note, at this speed, at this volume, for this duration, with these other notes. They are read and then played. They are rules for the future, outlining the sounds to be played.
Sonograms (also known as spectrograms) and waveforms exist after the sounds have been played. They are visual artifacts of the sound. Sonograms show the spectrum of frequencies in a sound selection with time along the horizontal axis and frequency along the vertical axis. The colour intensity often represents the amplitude of the individual frequencies. When frequency is shown logarithmically, rather than linearly, the musical and tonal relationships are emphasized.1
Scores and sonograms bracket the event of music being produced.
- A sonogram is a visual analysis of a recording, of sound already played
- By parsing out notes from the sonogram, I’m going through a translation of played > recorded > parsed > replayed in a new context
- Using the sonogram to approximate a note and then building it into the composition
- Bird songs are complex, polyphonic yet the score (In C) is composed of single notes, no chords – monophonic
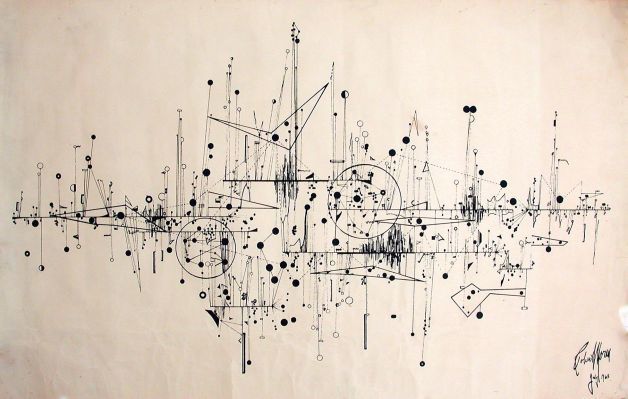
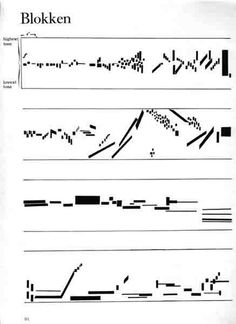
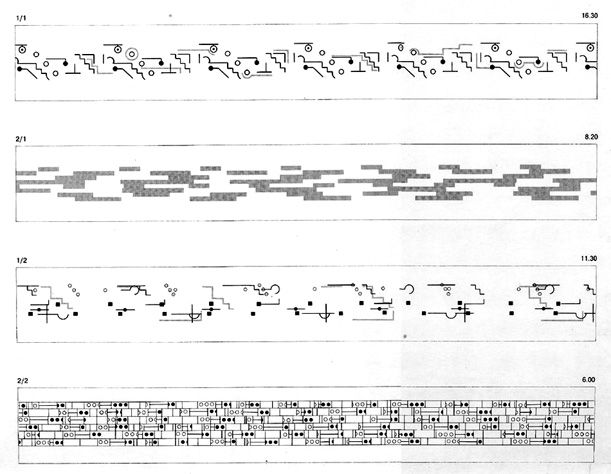
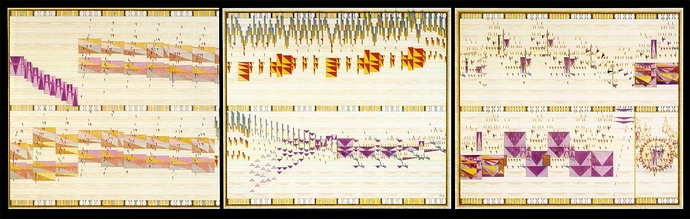
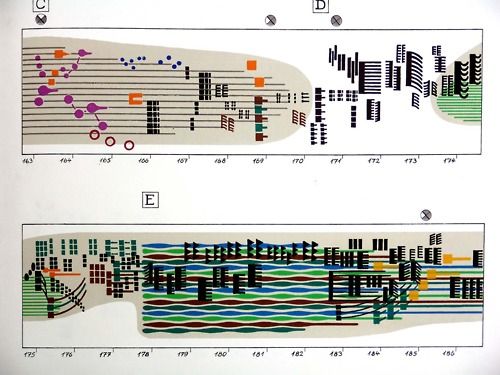
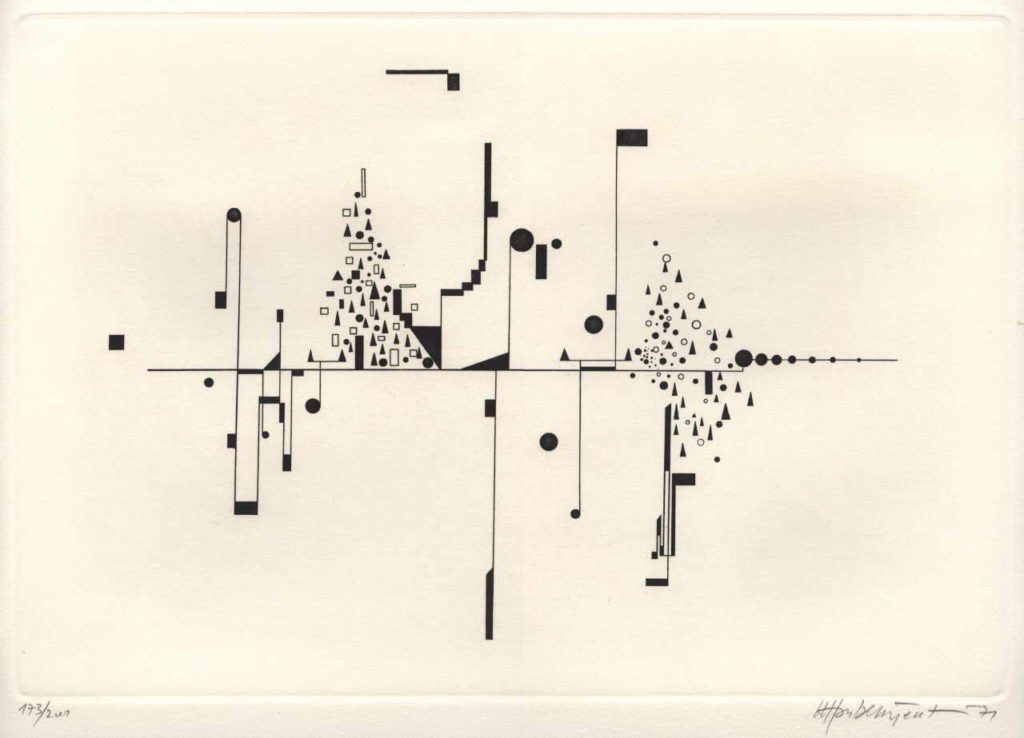
Experimental Notation Precedents