Routine Grid (034)

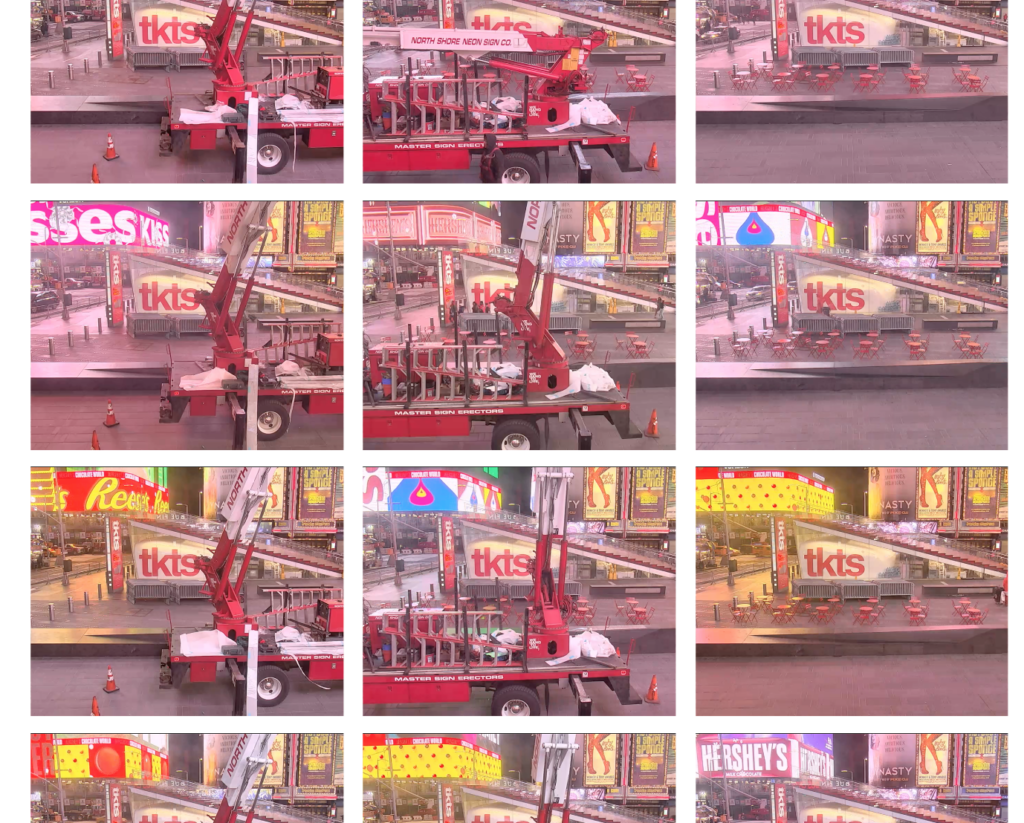
Routine Grid (034) studies Times Square from a fixed point-of-view, mapping change and routine over the course of five days.

Still frames were taken from a video feed and arranged chronologically, where each column represents a single day and rows show frames captured at the same time. The page scrolls automatically so users can focus on the difference and similarity within a day and between days. Does every time of day have a routine? Do the same people reappear?

People’s routines are made evident, but also routines of weather, advertisements, and furniture; of shadows, rain, and cold. The patterns repeat across days or within a day, an hour, a morning. Billboards reiterate their ads, but rarely at the same time every day. Regardless, their constant brightness makes time of day uncertain. Similarly, without the sky, weather is implied: by tone, shadow, or the wet reflection on the pavers.

Technicals

An applescript was set to capture frames from a live camera stream Times Square every 30 seconds over the course of a week. The “Lazy Load” library was used to incrementally load the images into the viewport. For autoscroll, scrollTop(currentPosition + 20) is called at a set interval.

Over 2,800 frames were collected each day, so a python script was created to automatically generate the HTML for each column. The script grabs the file names in a folder and loops through them to add the relevant HTML.

Next Steps
  • Resolve loading issue: occasionally loads by column rather than row

Centers and Boundaries (033)

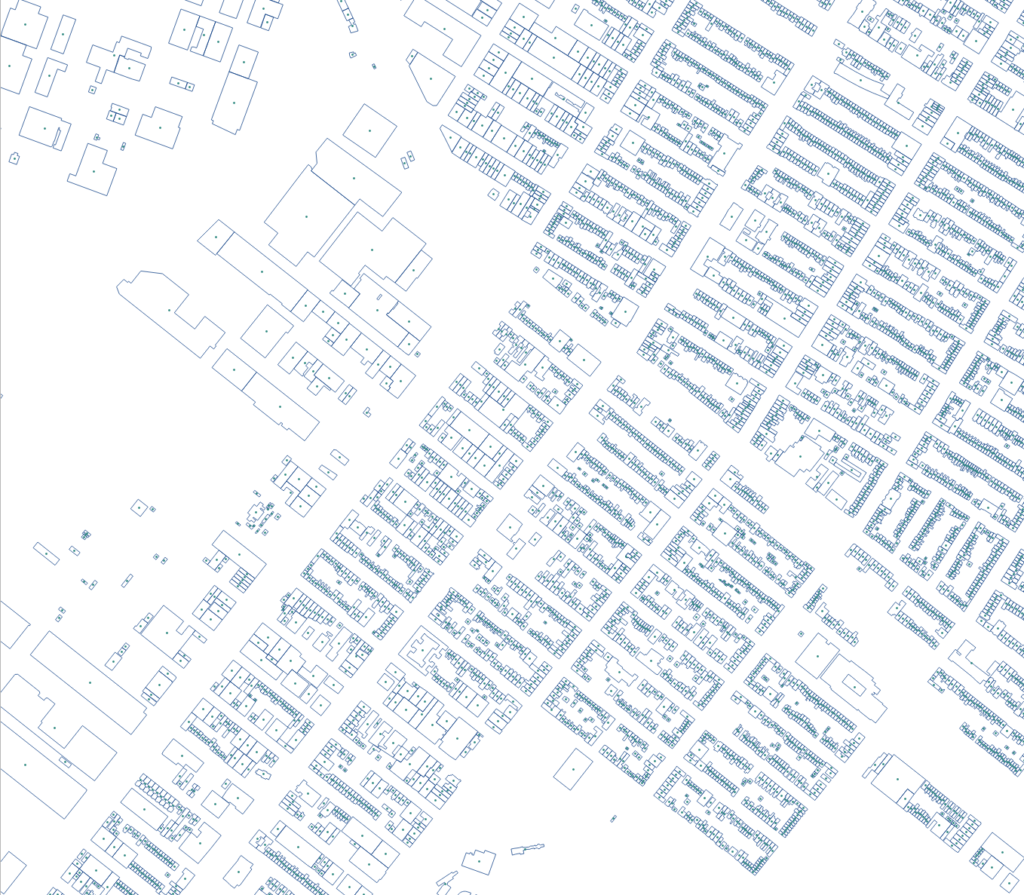
Centers and Boundaries considers how the representation of buildings — either as center points or figure-ground — can prompt different readings of a map.

As center points, all buildings are represented the same way. Therefore, the map emphasizes individuation, density, and distribution — whether regular or seemingly random. Regularly spaced center points suggest identical forms, perhaps brownstones, while more idiosyncratic distributions obscure whether a building is large and consuming or small and isolated. When regularly distributed, orientation can be inferred. Yet, without footprints, it is hard to tell where back yards and front yards are situated.

On hover, points are replaced with a figure-ground, establishing a binary absent in the center point representation. Undifferentiated, the figures appear as super-blocks, where a long thin rectangle may actually be eighteen individual buildings. Here, edges and figure take precedence over the individuation of the points.

Technicals

Building footprint data was sourced from the NYC Open Data platform. Center points were extracted in QGIS and then both points and footprints were exported as GEOJSONs to be displayed on the web using Mapbox.

Next Steps
  • Play with colors. Should the dots be purple, so it’s a full reversal? How small can they be while still being legible?

Foreground Middleground Background (032)

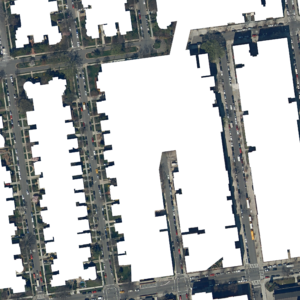
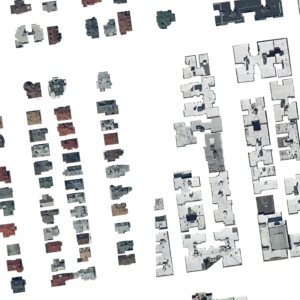
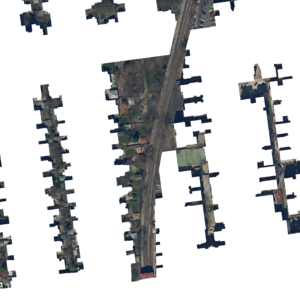
Foreground Middleground Background questions the typical figure-ground binary by differentiating building from ground, but also ground into front-yard and back-yard.

Having two ‘others’, each image presents as an entirely different place. The image of the front-yards leaves one asking whether the buildings are block-sized monoliths. The removal of the backyards and buildings also adds ambiguity, concealing two types of dwellings: detached houses and multi-family apartments. When the buildings are seen in isolation, one part of a typical figure-ground, the difference is evident. Back-yards, less formal than the front, reveal a defining characteristic of the scene: a bisecting subway rail cut.

Unexpectedly, hover doesn’t correspond to the location of the three figures, but rather moves between them with a simple left-right movement.

Technicals

The outlines for each layer were traced in Rhino—a CAD program. They were then imported into Photoshop as smart objects to create a mask for each layer, which were saved as separate image files. The mouse’s position on screen changes between the layers, where each third of the browser viewport reveals a different layer.

Next Steps
  • Consider geolocating the map and adding transparent features for each layer, so the conceal-and-reveal interaction corresponds to what is located at the mouse’s position.
  • Consider adding a fourth figure, dividing the street from the sidewalk and front yards.

Tile Walk (031)

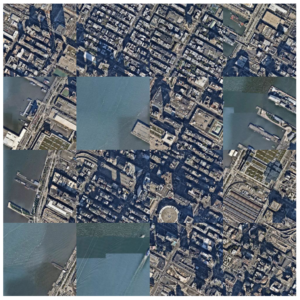
Tile Walk shuffles the aerial image of a user’s location as they walk, confusing where one is and where one wants to go. The familiar context of trees, streets, and buildings become unrecognizable as they’re bisected and placed in new relationships within the aerial.

The map builds on the earlier Tile Swap (005), but situates the user geographically and at a smaller scale. Interaction is determined by the positioning of the body, distinct from the movement of a computer mouse. As the map only updates with a user’s changing position, it seems to follow you while moving. But with each update, one has to relearn the contents of the map and the relationship to their own position.

At a smaller scale than Tile Swap (005), the shuffling is more disorienting: everything within one’s street-level field of view is shuffled. What one sees and experiences isn’t contained within a single tile but actually split across many.

The exercise explores how representative is an aerial image of its street-level counterpart? Does it matter that the aerial image is shuffled? Are features shown within the aerial identifiable at street level? Without the ability to pan through the map, do users walk further in order to see different aerials?

Technicals

Rendering the shuffled map is achieved in the same way as Tile Swap (005); the original aerial canvas is hidden, but used as a data source to draw re-tiled images to a new canvas element.

The site accesses a device’s geolocation with the navigation.geolocation methods and continually tracks movement using the watchLocation() function. When the position changes, the map pans.

Next Steps
  • Permanently assign what tiles are swapped rather than randomizing the pairs. Because there are only 9 tiles, often one or two remain in their original location when doing a random shuffle.
  • Explore how to smooth the movement from place to place. The updating location is received sporadically which causes the map to appear jumpy.
 Couple With
  • This Is What I See – But Not Really (028)
  • Tile Swap (005)

A Different Similar Center (030)

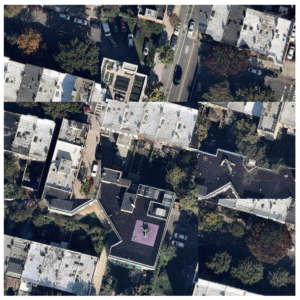
A Different Similar Center asks the question: how do we identify similarity and difference? Using data from a machine learning model, the center tile of an aerial image is replaced with a cycle of similar but geographically disparate tiles.

Although visually similar, the edge of the center tile hints at something strange. Roads form dead-ends, buildings are sliced in half, paths are disconnected. Yet, at times these same edges are almost indistinguishable. A tree canopy from one area blends into another or an unmarked field slyly fits into a patch elsewhere.

By re-contextualizing the center, the exercise asks:

  • What is similar — the color of the trees, the total area of pavement, the membrane on the roofs, the edge of the extent?
  • What role does context have in the identification of similarity, for an algorithm and for direct observation?
  • Do we identify similarity in the same way as an algorithm, especially when that algorithm was designed by humans?
Technicals

This project uses data from Terrapattern, which identified visual similarity in the aerial images of large geographic areas. When you click on a location, visually similar places are downloadable as a GEOJSON file. The similarity data was collected for ten locations in New York City, focusing on cemeteries and public housing. “A Different Similar Center” displays a different starting point with each page load and internally iterates through the matches.

Terrapattern was developed by Golan Levin, David Newbury, Kyle McDonald, Irene Alvarado, Aman Tiwari, and Manzil Zaheer, at the Frank-Ratchye STUDIO for Create Inquiry at Carnegie Mellon University. The Github repository for the project extensively describes the backend processes.

Next Steps
  • Ask Terrapattern if a complete dataset matching all points with all similar points is available.
  • Collect the similarity GEOJSON files for more locations manually.
  • Render as images, not geolocated, to improve performance.