Dominant Forms: Height (017)

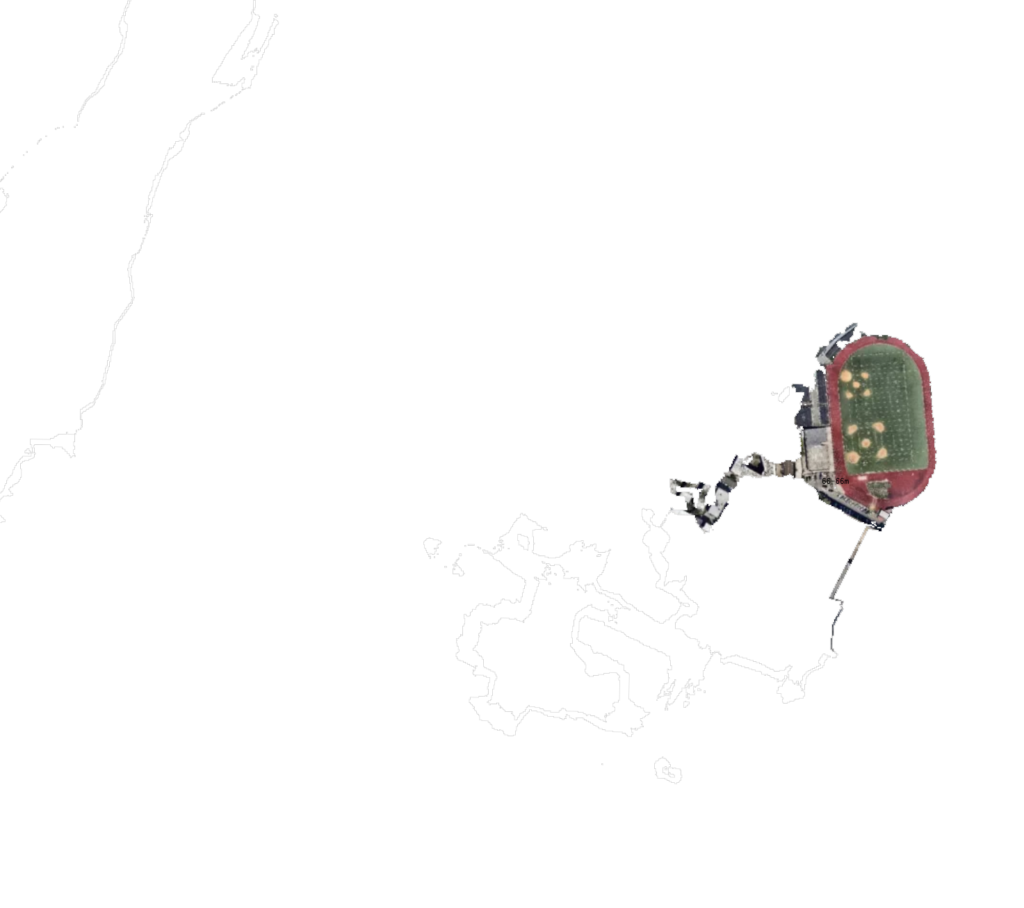
Dominant Forms: Height (live link) uses commonly represented data — elevation — to create islands within New York City. On hover, contours of the same elevation are filtered and used to mask an aerial image.

Contours are vertical data represented in the horizontal plane; lines from which everything else is higher or lower. When combined with aerial imagery, contours cut through streets, buildings, parks, and other dominant boundaries. Steepness, and its counterpart, flatness, identify neighborhoods like Washington Heights and Red Hook. Yet, this indiscriminate dissection of the city goes unnoticed in the abstraction of orthographic representation.

The interaction is constrained to three scales, each with contours taken at different intervals. At the smaller scale, cars and buildings are bisected, whereas the larger scale identifies neighborhoods and infrastructure. Panning is restricted to focus the interaction on contour selection. A prototyping mode allows panning to identify areas of interest.

Using “Raster to Polygons” in QGIS, raster DEM data were transformed into polygons of the same elevation. Because the DEM data are tiled, an important next step is to dissolve boundaries between adjacent polygons of the same elevation.

Next Steps:

  • Replace current contours with dissolved contours in which each elevation forms a group of polygons.
  • Avoid intersections?
  • Can the angle be more precise so that it’s looking down, not to the side? Average direction of next 5-10 points rather than just the next point? How is bearing determined? (QGIS)

Compare To:

  • Sampling Prospect Park (016)
  • Dominant Forms: Areas (011)
  • Dominant Forms: Streets (forthcoming)

Sampling Prospect Park, Describing Prospect Park (016)

Sampling Prospect Park, Describing Prospect Park (live link) represents four ways of sampling elevation and two ways of describing it. Points are first differentiated by sampling method. Then, on hover, points are culled and associated in a different way: by corresponding height.

Continuous paths become fragmented, while neighbors in plan are found to have different neighbors in section. Points that were once similar are now different.

Points within a +/- 2ft range from all sampling groups are isolated. The following data sources were used: points sampled from a raster DEM (USGS 1m) at set intervals; points recorded with a GPS data logger at approximately set intervals; points recorded along a path every 12 seconds with a GPS data logger; and points sampled from spot elevations, at the highest part of a building or feature, captured by New York City. All points are located by satellite — in one way or another — and are distinct only in what was chosen to be identified by elevation.

Additional information on the data collection process is detailed in the post, “Field Data Collection (001): Prospect Park Walk“.

Next Steps:

  • Explore whether all sampling methods should have the same representation on hover, or maintain their previous shape and color.

Compare To:

  • Light In The Apartment (010)
  • Center Points vs Boundaries (forthcoming)

Looking Down (015)

Looking Down (live link) catalogs aerial images taken at a set of points in Prospect Park. The images are positioned relative to these points. On hover, an aerial image flips to an image of the sky taken at the same point.

“Looking Down (015)” is coupled with “Looking Up (012)”. In juxtaposing photographs of the sky with GPS accuracy readings, “Looking Up” described the relationship between tree canopy, open space, and accuracy. By exchanging one half of the pair, accuracy readings, for aerial images of the same location, “Looking Down” asks: does the sky match the ground? Does the ground provide context for the sky or vice versa? Does the human-scale of the sky-facing image alienate the otherwise familiar, but detached aerial perspective? Does the sky or ground seem more continuous than the other?

Field documentation methods are detailed in the post, “Field Data Collection (001): Prospect Park Walk“.

Next Steps:
– Pixelate images according to the accuracy reading on hover.
– Layout images according to recorded GPS coordinates at each point rather than the idealized grid. Some images will overlap and some will misalign.
– On hover, randomly flip half of all tiles, so that you never see all of the ground or the sky.
– On refresh, start with the aerial; refresh again, start with the sky.

Compare to:
– Looking Up (012)

Subway Stream (014)

Subway Stream (live link) presents the advertisements of two subway stations as images whizzing by like passing trains. As more stations are added: How is a particular subway station identifiable from its set of ads? What ads repeat across stations and within a station? Where is there vacancy?

Photographs were taken the morning of Tuesday, January 23rd at the Seventh Avenue B/Q stop in Brooklyn and the Prince Street 6 stop in Manhattan. The automatic movement of the images is achieved through an interval function calling scrollLeft() every 50ms and sliding the images over 200px.

Next steps:

  • Add additional subway stations in different parts of the city.
  • Clean up code: make a class from which each station is instantiated, include direction, speed and extents as properties.

A Walk Three Ways (013)

A Walk Three Ways (013) is a triptych of a single walk through Prospect Park. Users can scrub through an altitude graph, aerial image, and plan, all of which describe the same route.

The linearity of the altitude graph conceals the circuitousness of the path that it describes; whereas, in plan, the tangled path obscures any notion of topographic variation. The aerial image, while still planimetric, begins to illustrate the conditions that lead to the variation in both dimensions. The interaction links these differences: hovering over one aligns the others to the same position.

The walk followed grid-points spaced at 200m. The data collection process is detailed in the post “Field Data Collection (001): Prospect Park Walk“. The path was recorded using a Bad Elf GPS data logger and processed in QGIS, from which it was exported to GEOJSON. The altitude graph was built using d3.js, while the map-based representations used Mapbox GL.

Next Steps:

  • Adjust zoom levels such that each visible extent is the same, and try another in which they are distinctly different.
  • Smooth out the path by culling points recorded when we were stationary.
  • Remove panning from aerial representation, or add interaction which snaps to the closest point on the path.
  • Adjust x-axis of altitude graph to reflect time more accurately.
  • Add hover interaction to plan representation.