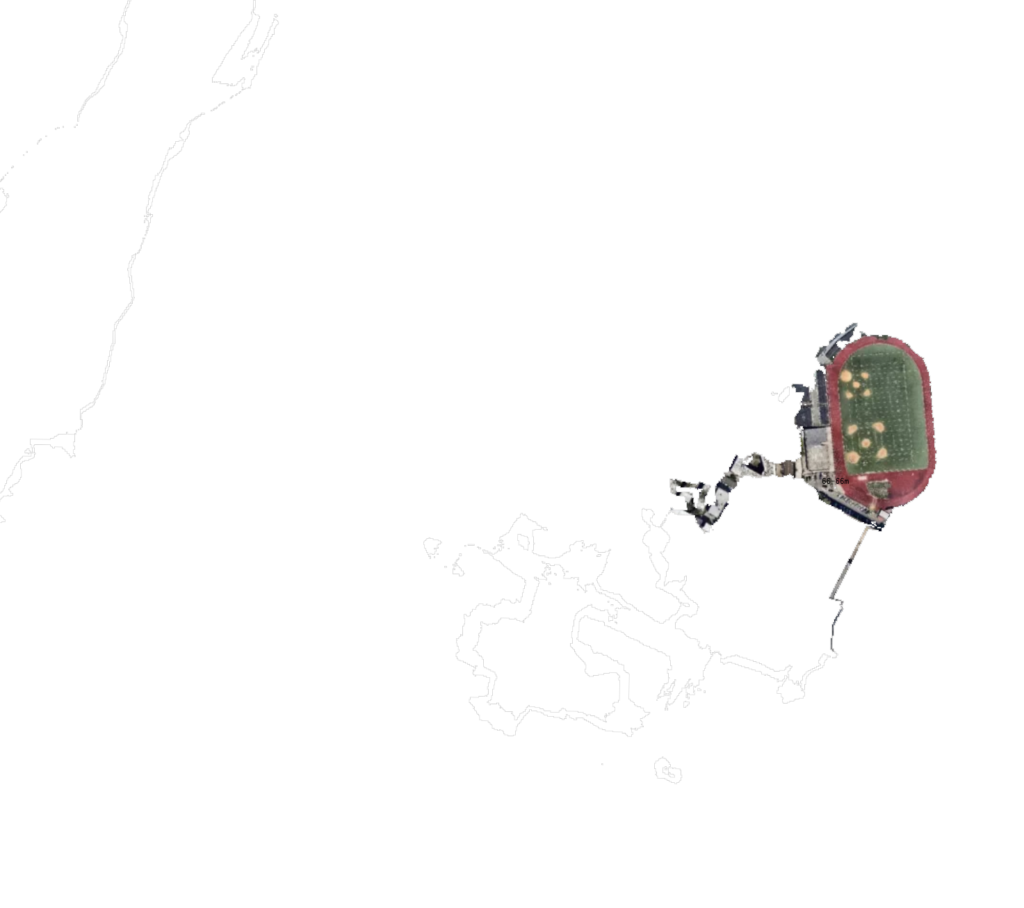
Dominant Forms: Height (live link) uses commonly represented data — elevation — to create islands within New York City. On hover, contours of the same elevation are filtered and used to mask an aerial image.
Contours are vertical data represented in the horizontal plane; lines from which everything else is higher or lower. When combined with aerial imagery, contours cut through streets, buildings, parks, and other dominant boundaries. Steepness, and its counterpart, flatness, identify neighborhoods like Washington Heights and Red Hook. Yet, this indiscriminate dissection of the city goes unnoticed in the abstraction of orthographic representation.
The interaction is constrained to three scales, each with contours taken at different intervals. At the smaller scale, cars and buildings are bisected, whereas the larger scale identifies neighborhoods and infrastructure. Panning is restricted to focus the interaction on contour selection. A prototyping mode allows panning to identify areas of interest.

Using “Raster to Polygons” in QGIS, raster DEM data were transformed into polygons of the same elevation. Because the DEM data are tiled, an important next step is to dissolve boundaries between adjacent polygons of the same elevation.
Next Steps:
Replace current contours with dissolved contours in which each elevation forms a group of polygons.- Avoid intersections?
- Can the angle be more precise so that it’s looking down, not to the side? Average direction of next 5-10 points rather than just the next point? How is bearing determined? (QGIS)
Compare To:
- Sampling Prospect Park (016)
- Dominant Forms: Areas (011)
- Dominant Forms: Streets (forthcoming)