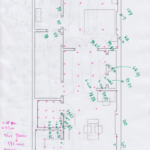
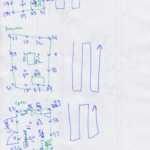
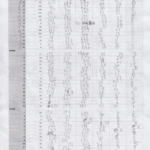
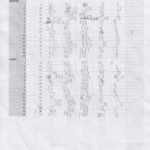
“Light In The Apartment” (live link) represents light meter readings taken every 96 minutes between sunrise and sunset on January 19th, 2018. Measurements were taken from a 16-point grid within each room of an apartment, resulting in a different density of readings in each space.
Current representation locates the points as they were distributed in space. As such, smaller rooms appear brighter because the circles describing each reading overlap at peak periods. As a counterpoint, there will be a second representation where points will be uniformly spaced.
Points were marked out within the apartment using tape, and measured room by room in the same order each time.
The iPhone app ‘Light Meter’ was used to take the readings, and as such, measurements are acknowledged as being imprecise. Anything directly above the sensor, including clothing hanging on a door or kitchen cabinets, significantly impacted readings. However, the exercise became more about the representation of data collection than measurement accuracy.
Compare to:
- Identifying Darkness (003)
- Cardinal Direction (forthcoming)
- Centerpoints v. Boundaries (forthcoming)


One thought on “Light In The Apartment (010)”
Comments are closed.