Centers and Boundaries considers how the representation of buildings — either as center points or figure-ground — can prompt different readings of a map.
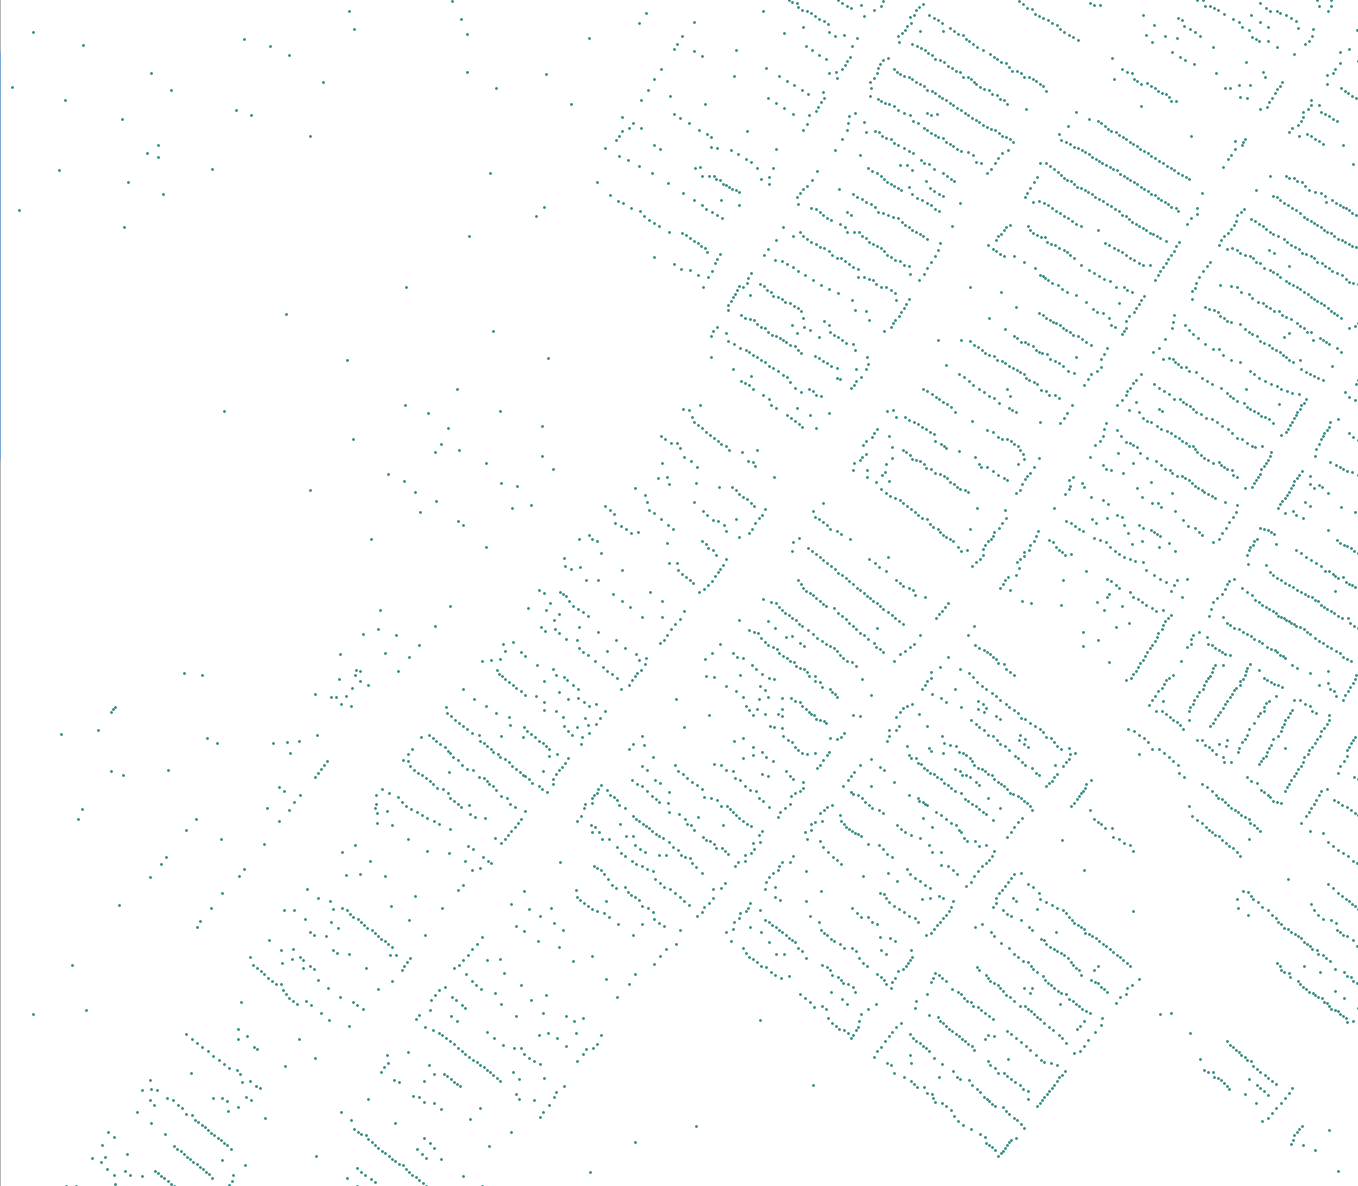
As center points, all buildings are represented the same way. Therefore, the map emphasizes individuation, density, and distribution — whether regular or seemingly random. Regularly spaced center points suggest identical forms, perhaps brownstones, while more idiosyncratic distributions obscure whether a building is large and consuming or small and isolated. When regularly distributed, orientation can be inferred. Yet, without footprints, it is hard to tell where back yards and front yards are situated.
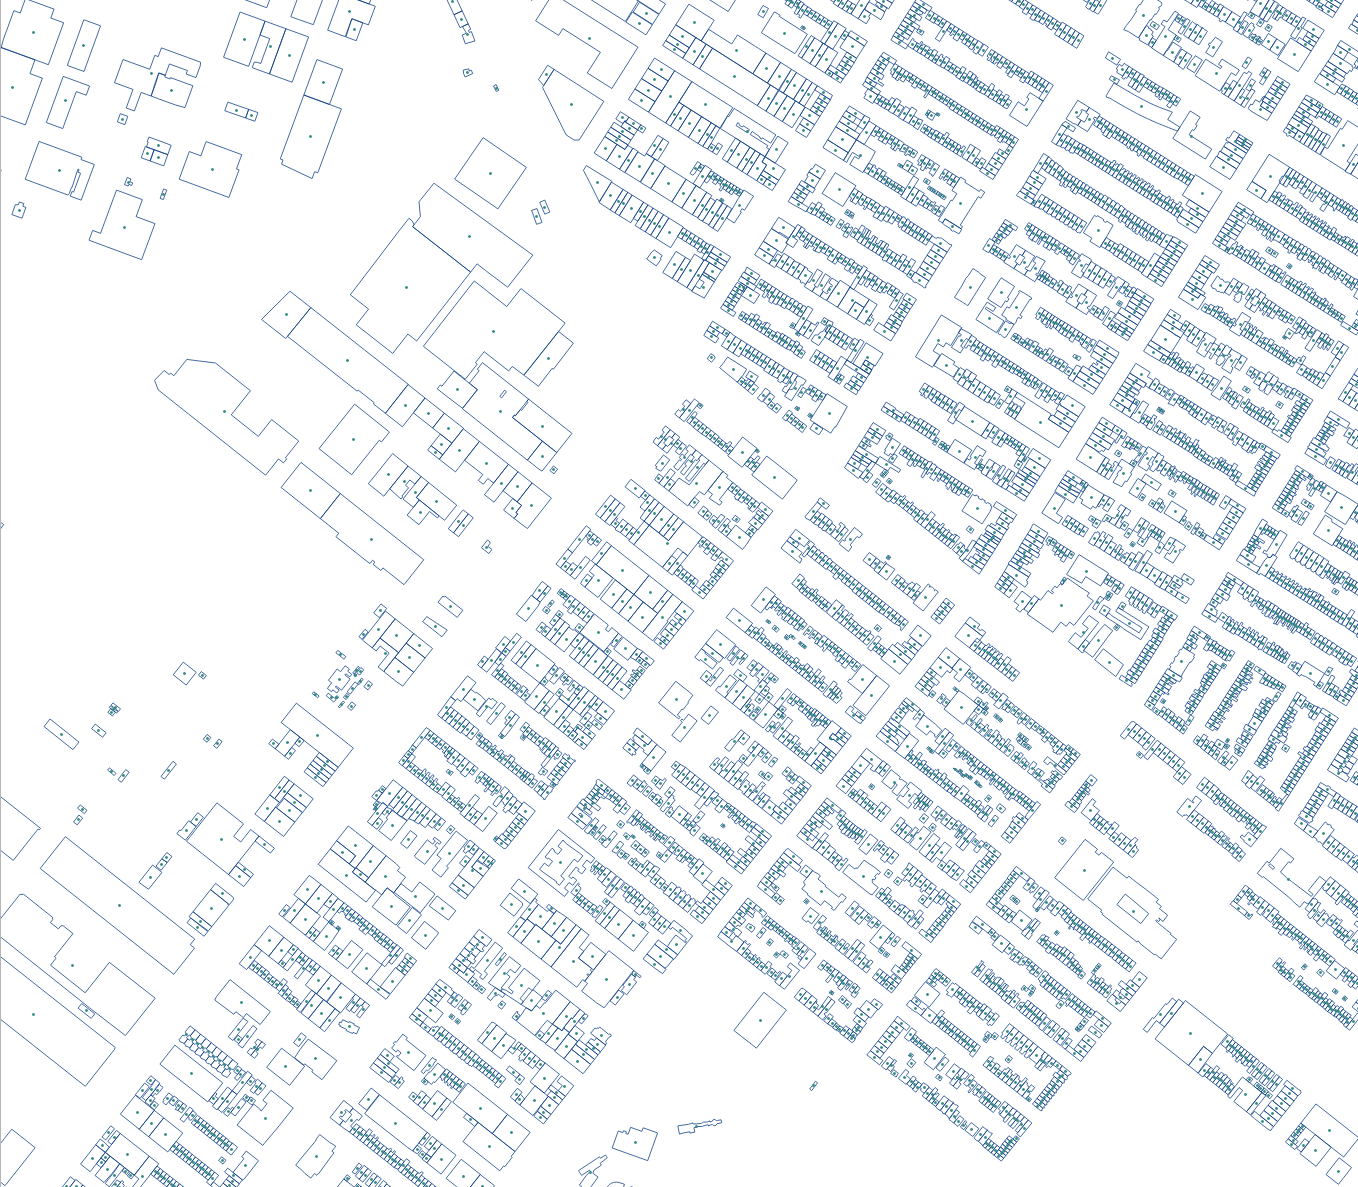
On hover, points are replaced with a figure-ground, establishing a binary absent in the center point representation. Undifferentiated, the figures appear as super-blocks, where a long thin rectangle may actually be eighteen individual buildings. Here, edges and figure take precedence over the individuation of the points.
Technicals
Building footprint data was sourced from the NYC Open Data platform. Center points were extracted in QGIS and then both points and footprints were exported as GEOJSONs to be displayed on the web using Mapbox.
Next Steps
- Play with colors. Should the dots be purple, so it’s a full reversal? How small can they be while still being legible?