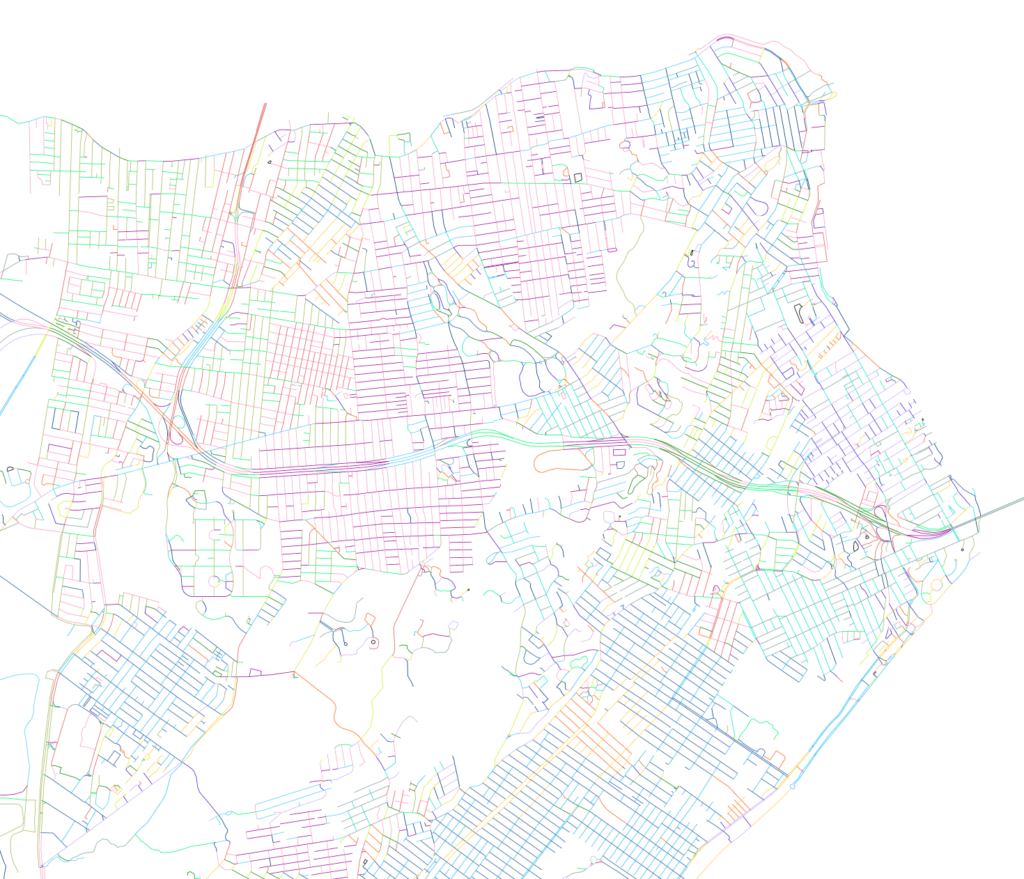
Parallel and Perpendicular illustrates the particularity of New York City’s many street grids, contrary to its imagined uniformity.
Streets are color coded by bearing angle to reveal a patchwork of many grids, knitted together and bisected by criss-crossing lines. Even in Manhattan, the exemplar of regularity, a red diagonal cuts through a sea of green.
Rainbows circumscribe islands: purple turns to orange turns to blue as the Bruckner and Major Deegan Expressways encircle the Bronx or as the Belt Parkway and Gowanus Expressway define Bay Ridge. The streets of Staten Island stand in contrast to the grids of the other boroughs. The patches are smaller, less distinct, and often made of curves and cul-de-sacs rather than straight lines.
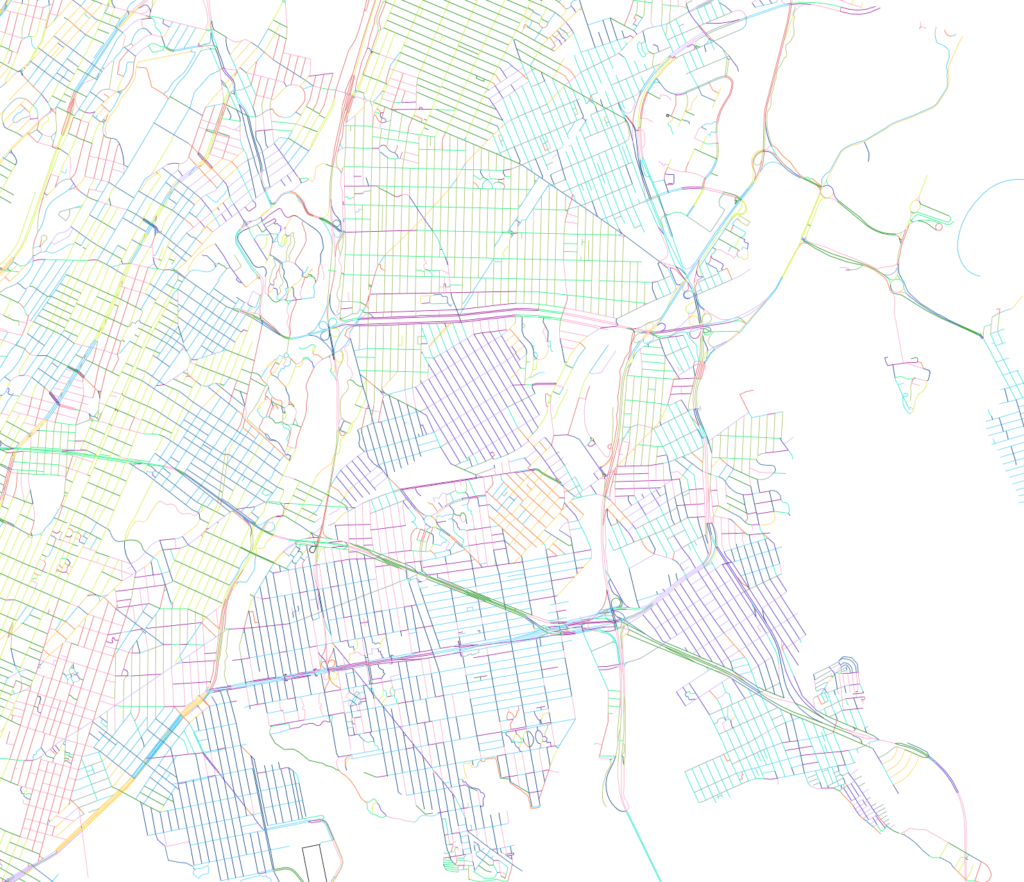
Does the extent of directionality figure into one’s imagining of a neighborhood? Do parallel and perpendicular lines in an area have the same extent? Why didn’t the relative uniformity of Manhattan extend to the other boroughs? How do straights lines identify a neighborhood differently than curved lines?
On click, streets within a -2.5/+2.5 degree range are isolated, and density and grain is made evident. Even though a street may have a certain angle, it may or may not form a neighborhood with streets at the same angle.

Technicals
The bearing angle of each line was added as a property using QGIS. The formula for determining this angle was found in a post (https://goo.gl/zSifeS) on GIS Overflow — a discussion board for technical GIS questions. While the formula originally mapped from 0 to 360 degrees, for the purposes of the map, the domain was adjusted to -180 to 180 and the absolute value was used.
Next Steps
- Improve performance by resolving loading time of the large street grid GEOJSON file.