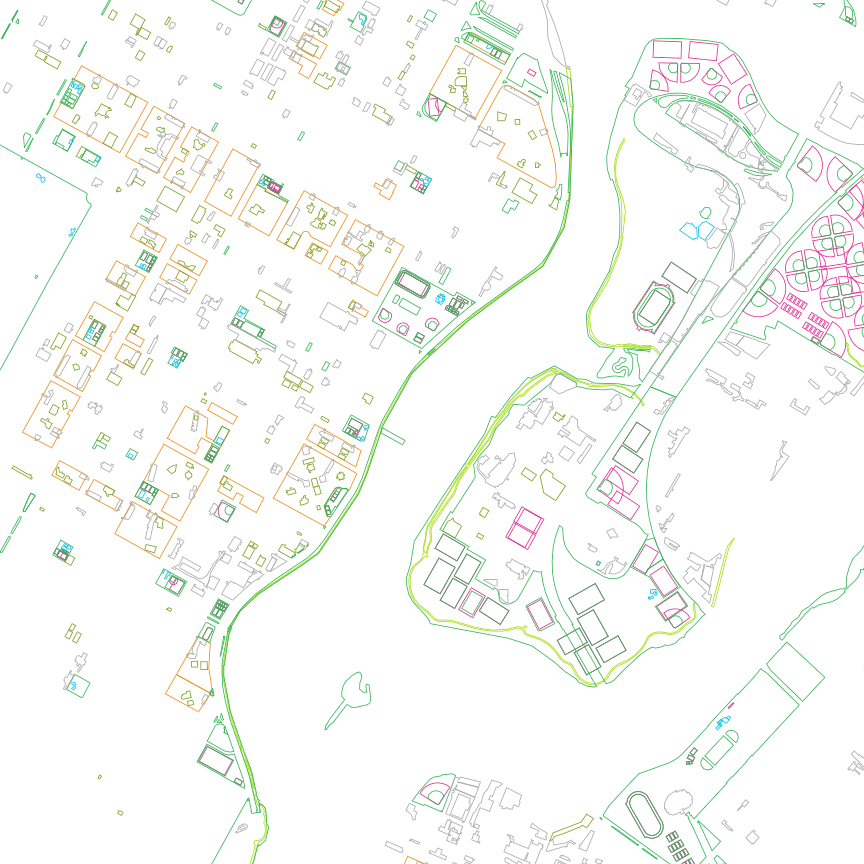
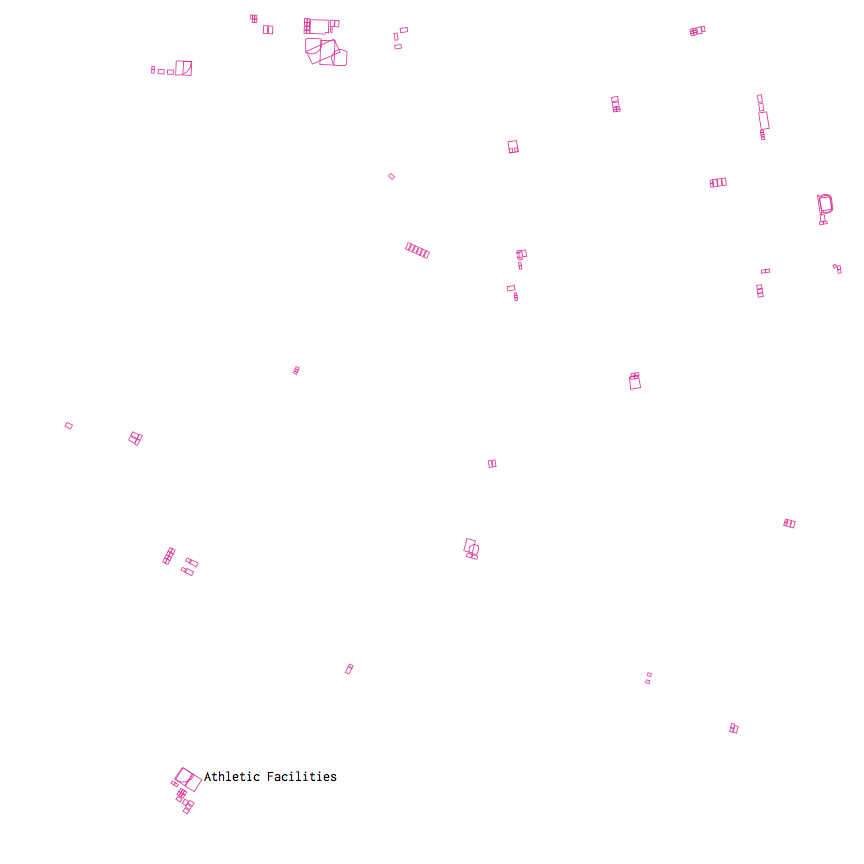
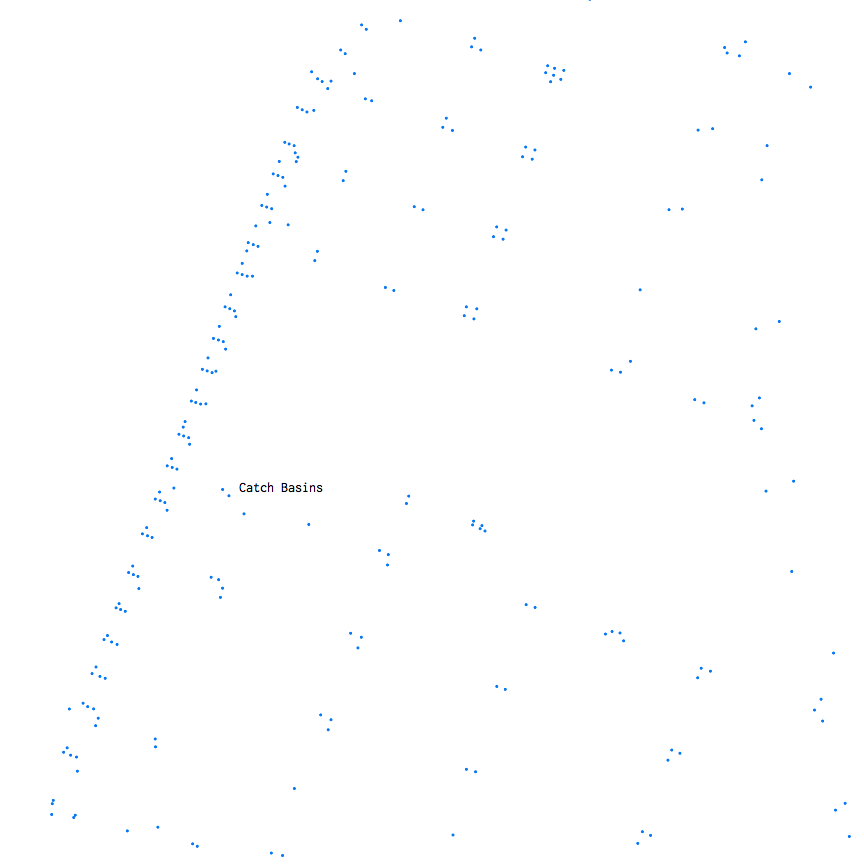
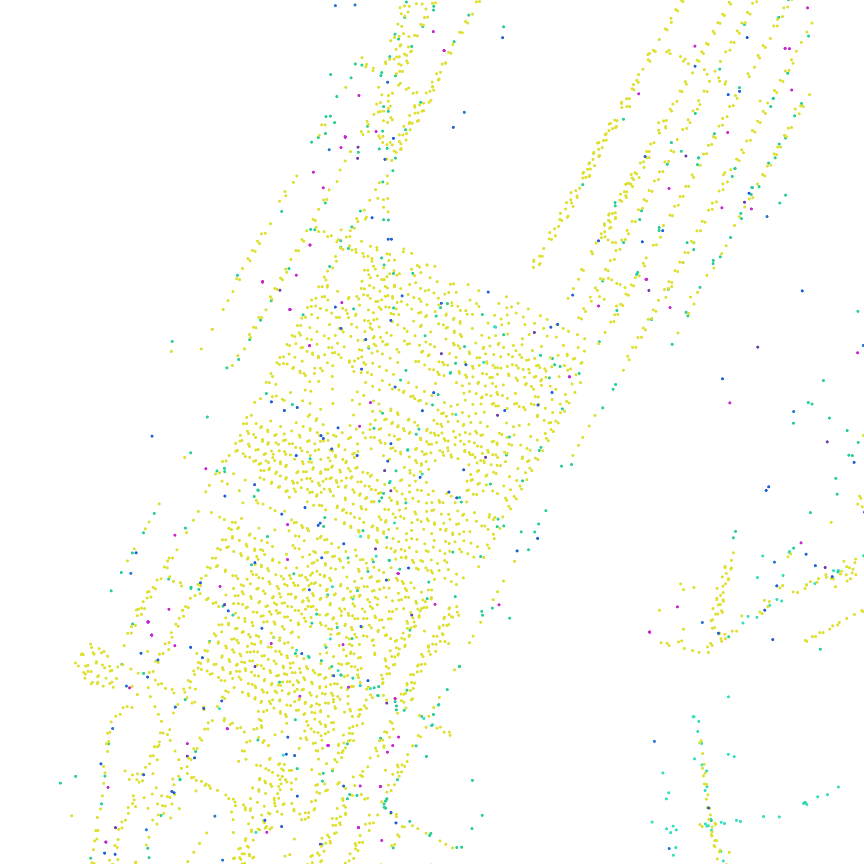
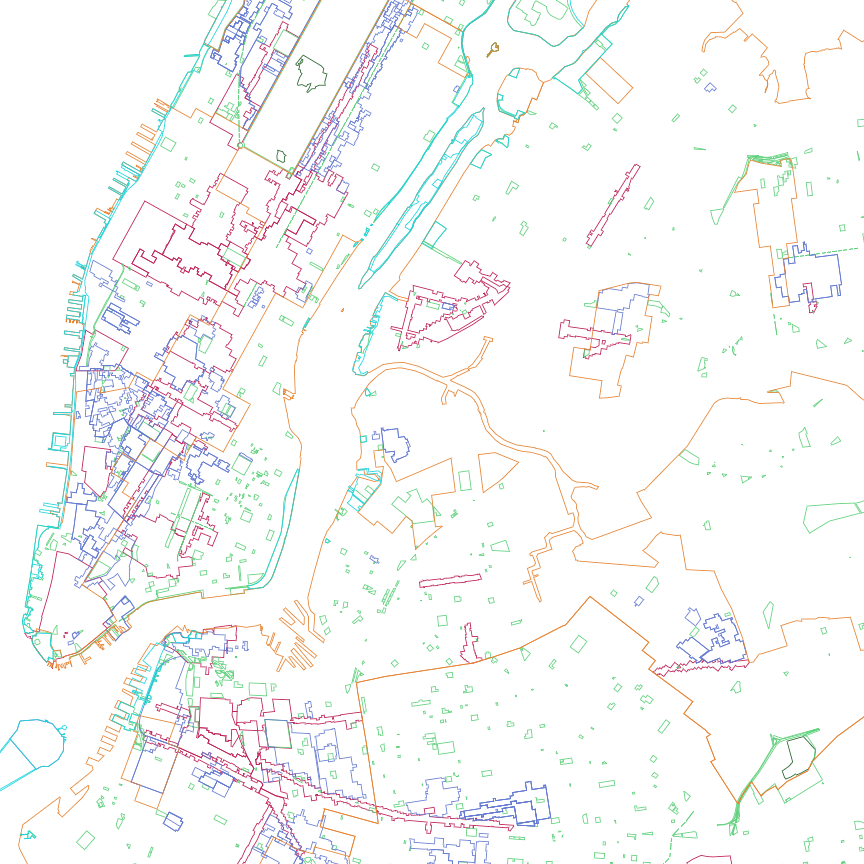
“Points & Polygons” is a series of four maps representing physical and organizational forms of New York City. (Live links: 01, 02, 03, 04)
Dominant forms — building footprints, street grids, and topography — are intentionally absent. However, their structuring influence is latent in everything from catch basins that describe invisible intersections to the even spacing of hydrants, playgrounds, and libraries.
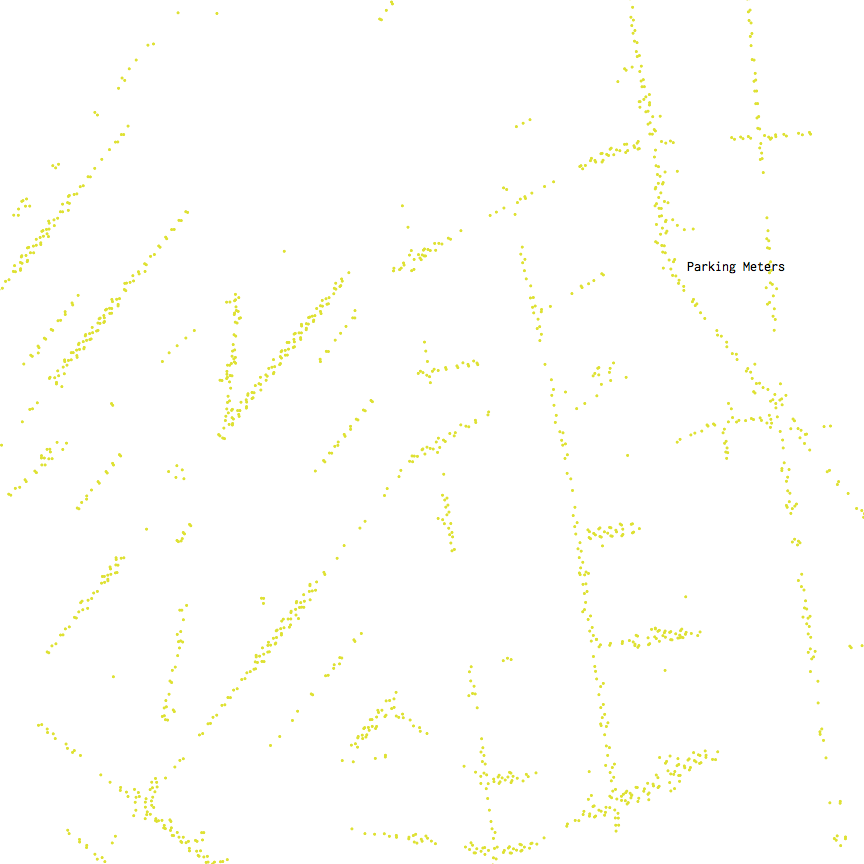
In constraining the interaction to only panning, the maps invite close examination, asking: What reasoning underpins the sporatic density of parking meters? Will the patterning of catch basins be imagined as a form of communication in a future archeological dig? What does the distribution of sports fields and playgrounds say about power relations in the city? What about the scale and location of housing authority properties? Is there such as thing as “Forever Wild” and can it be described as a polygon? Are there pools anywhere other than Mill Basin and Staten Island?
The maps are built with Mapbox GL’s API. Each shapefile was curated, then exported without modification as a GEOJSON object and loaded as an individual map layer. A mouse over function describes and isolates each layer.
Next steps:
The GEOJSON object for spot elevations was prohibitively large when loaded via the API. See if uploading to Mapbox Studio and converting to a tileset improves performance.January 17- Differentiate each layer internally by types (athletic facilities into tennis fields, pools, etc)
Add start points for each borough.January 17- Translate points into polygons for libraries, post offices and public schools (Points & Polygons 02).
- Translate polygons into points for play areas, parking lots, athletic facilities and NYCHA properties (Points & Polygons 03).
Add a debouncing function to smooth the hover effect.January 17- Fill polygons with solid color on hover.
- Add menu to page to allow jumping between maps without spacebar.
- Allow visitors to take screenshots that can be added to a gallery.
- Code the various point objects with symbols, e.g. squares, triangles, crosses, etc.
- Add interaction for change to the next map while on a mobile device. The current interaction — pressing the space bar — doesn’t work.
Below is a list of selected data in each map:
01: Neighborhood (Points and Polygons)
– Catch basins
– Cooling towers
– Parking meters
– Hydrants
– Private pools
– Public pools
– Railroad structures
– Subway entrances
02: Polygon Distribution
– Athletic facilities
– Boardwalks
– NYC Housing Authority properties
– Open space, other
– Open space, parks
– Parking lots
– Play areas
03: Point distribution
– Bus stops
– Bus stop shelters
– Libraries
– Parking meters
– Post offices
– Public schools
– Spray showers
– Subway stations
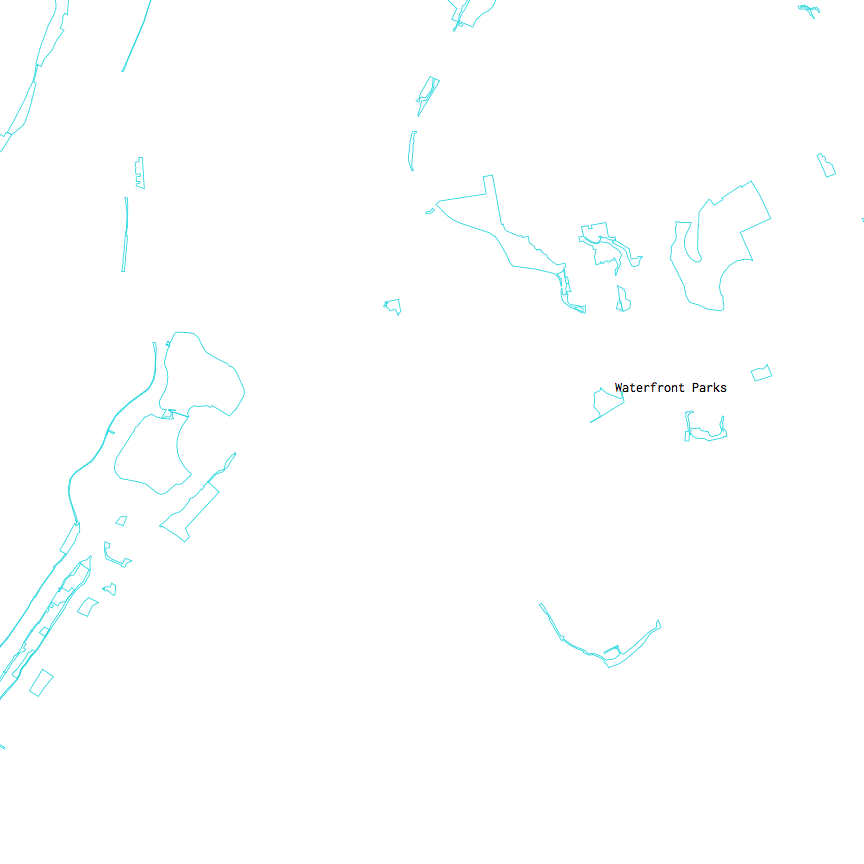
04: Areas
– Beaches
– Business improvement districts
– Forever wild designated areas
– Functional parkland
– Historic districts
– Fresh food stores zoning
– Waterfront parks