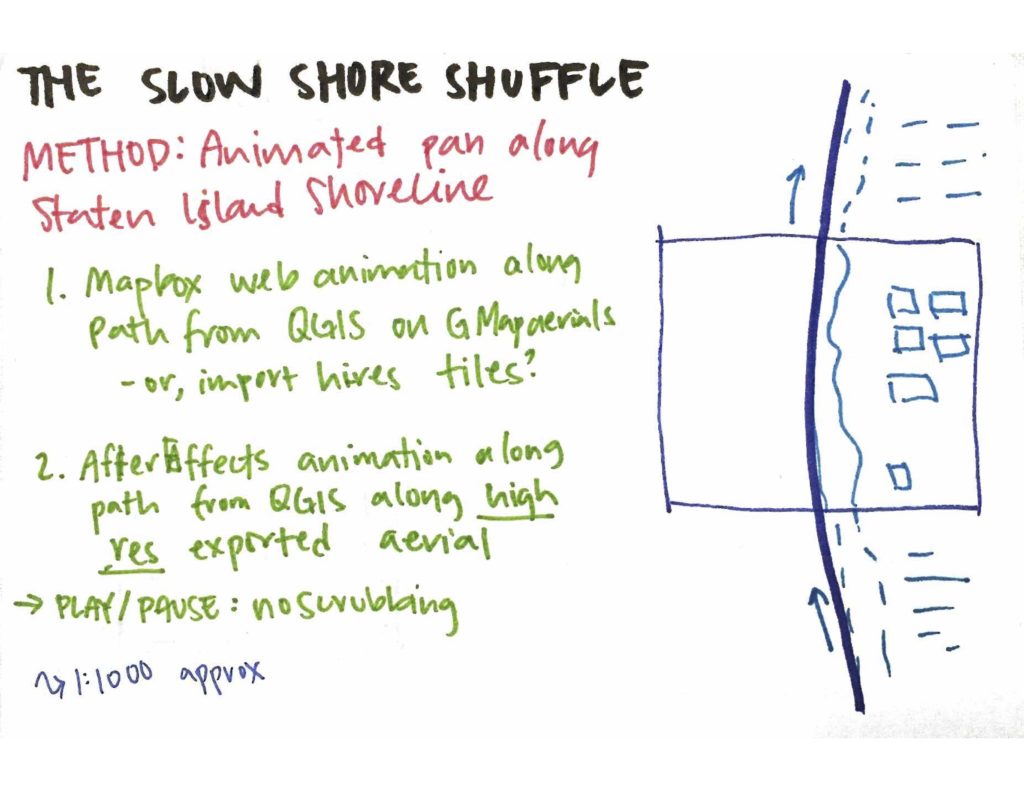
“Slow Shore Shuffle” follows the shoreline of Staten Island. Movement is unhurried and interaction is deliberately constrained — one can’t pause, resume, pan, or zoom. The island is never shown in its entirety, and once out of frame, the same place isn’t seen again until the video loops back around.
Mapbox GL API is used to load aerial imagery from Digital Globe. The animation and changing orientation is achieved with the panTo() method which animates the map to a given coordinate. A smoothed bearing orientation is calculated by averaging the angle between three consecutive coordinates-pairs.
QGIS was used to generate the coordinates. The shoreline SHP file is available from NYC Open Data, however, the borough boundary was more useful, as it didn’t include inland streams. The Cartographic Line Generalization plugin was used to further smooth and simplify polygon geometry. Data was transformed from New York Long Island (EPSG:2263) projection to WGS 84 (EPSG:4326), which is used in Mapbox. Points were then generated at a regular interval along the length and exported to a CSV using the MMQGIS plugin. Lastly, the CSV file was converted to JSON for easy iteration, value-fetching, and loading into javascript.
Note: Colin Reilly has a nice blog post speculating on the choice of using the New York Long Island projection for NYC spatial data.
Next Steps:
- Remove “knots” in the original shapefile to prevent the circling-rotation
2 thoughts on “Slow Shore Shuffle (001)”
Comments are closed.