The development of the maps interface continues. A big part of this week was building out the database with MongoDB and expanding the API so that workspaces can be saved and retrieved, in addition to storing the individual maps. This project really focuses on creating and identifying relationship between multiple maps so I put the design iterations on hold until building out some of this infrastructural stuff. Now that I can save and load different configurations, it’s back to focusing on the interaction and information. When a group is selected, what is shown in the info panel? How to display and access different versions of a single workspace — does it auto-save, or can I bookmark important revisions?
The challenge of making 100 daily maps — or any creative project — is how to explore all the material generated in the process. How does the writing connect to the sketches connect to the initial brainstorm? How do you identify the ideas that weren’t pursued but latent with potential? How does one part of a project relate to another? Or relate to a different project entirely?
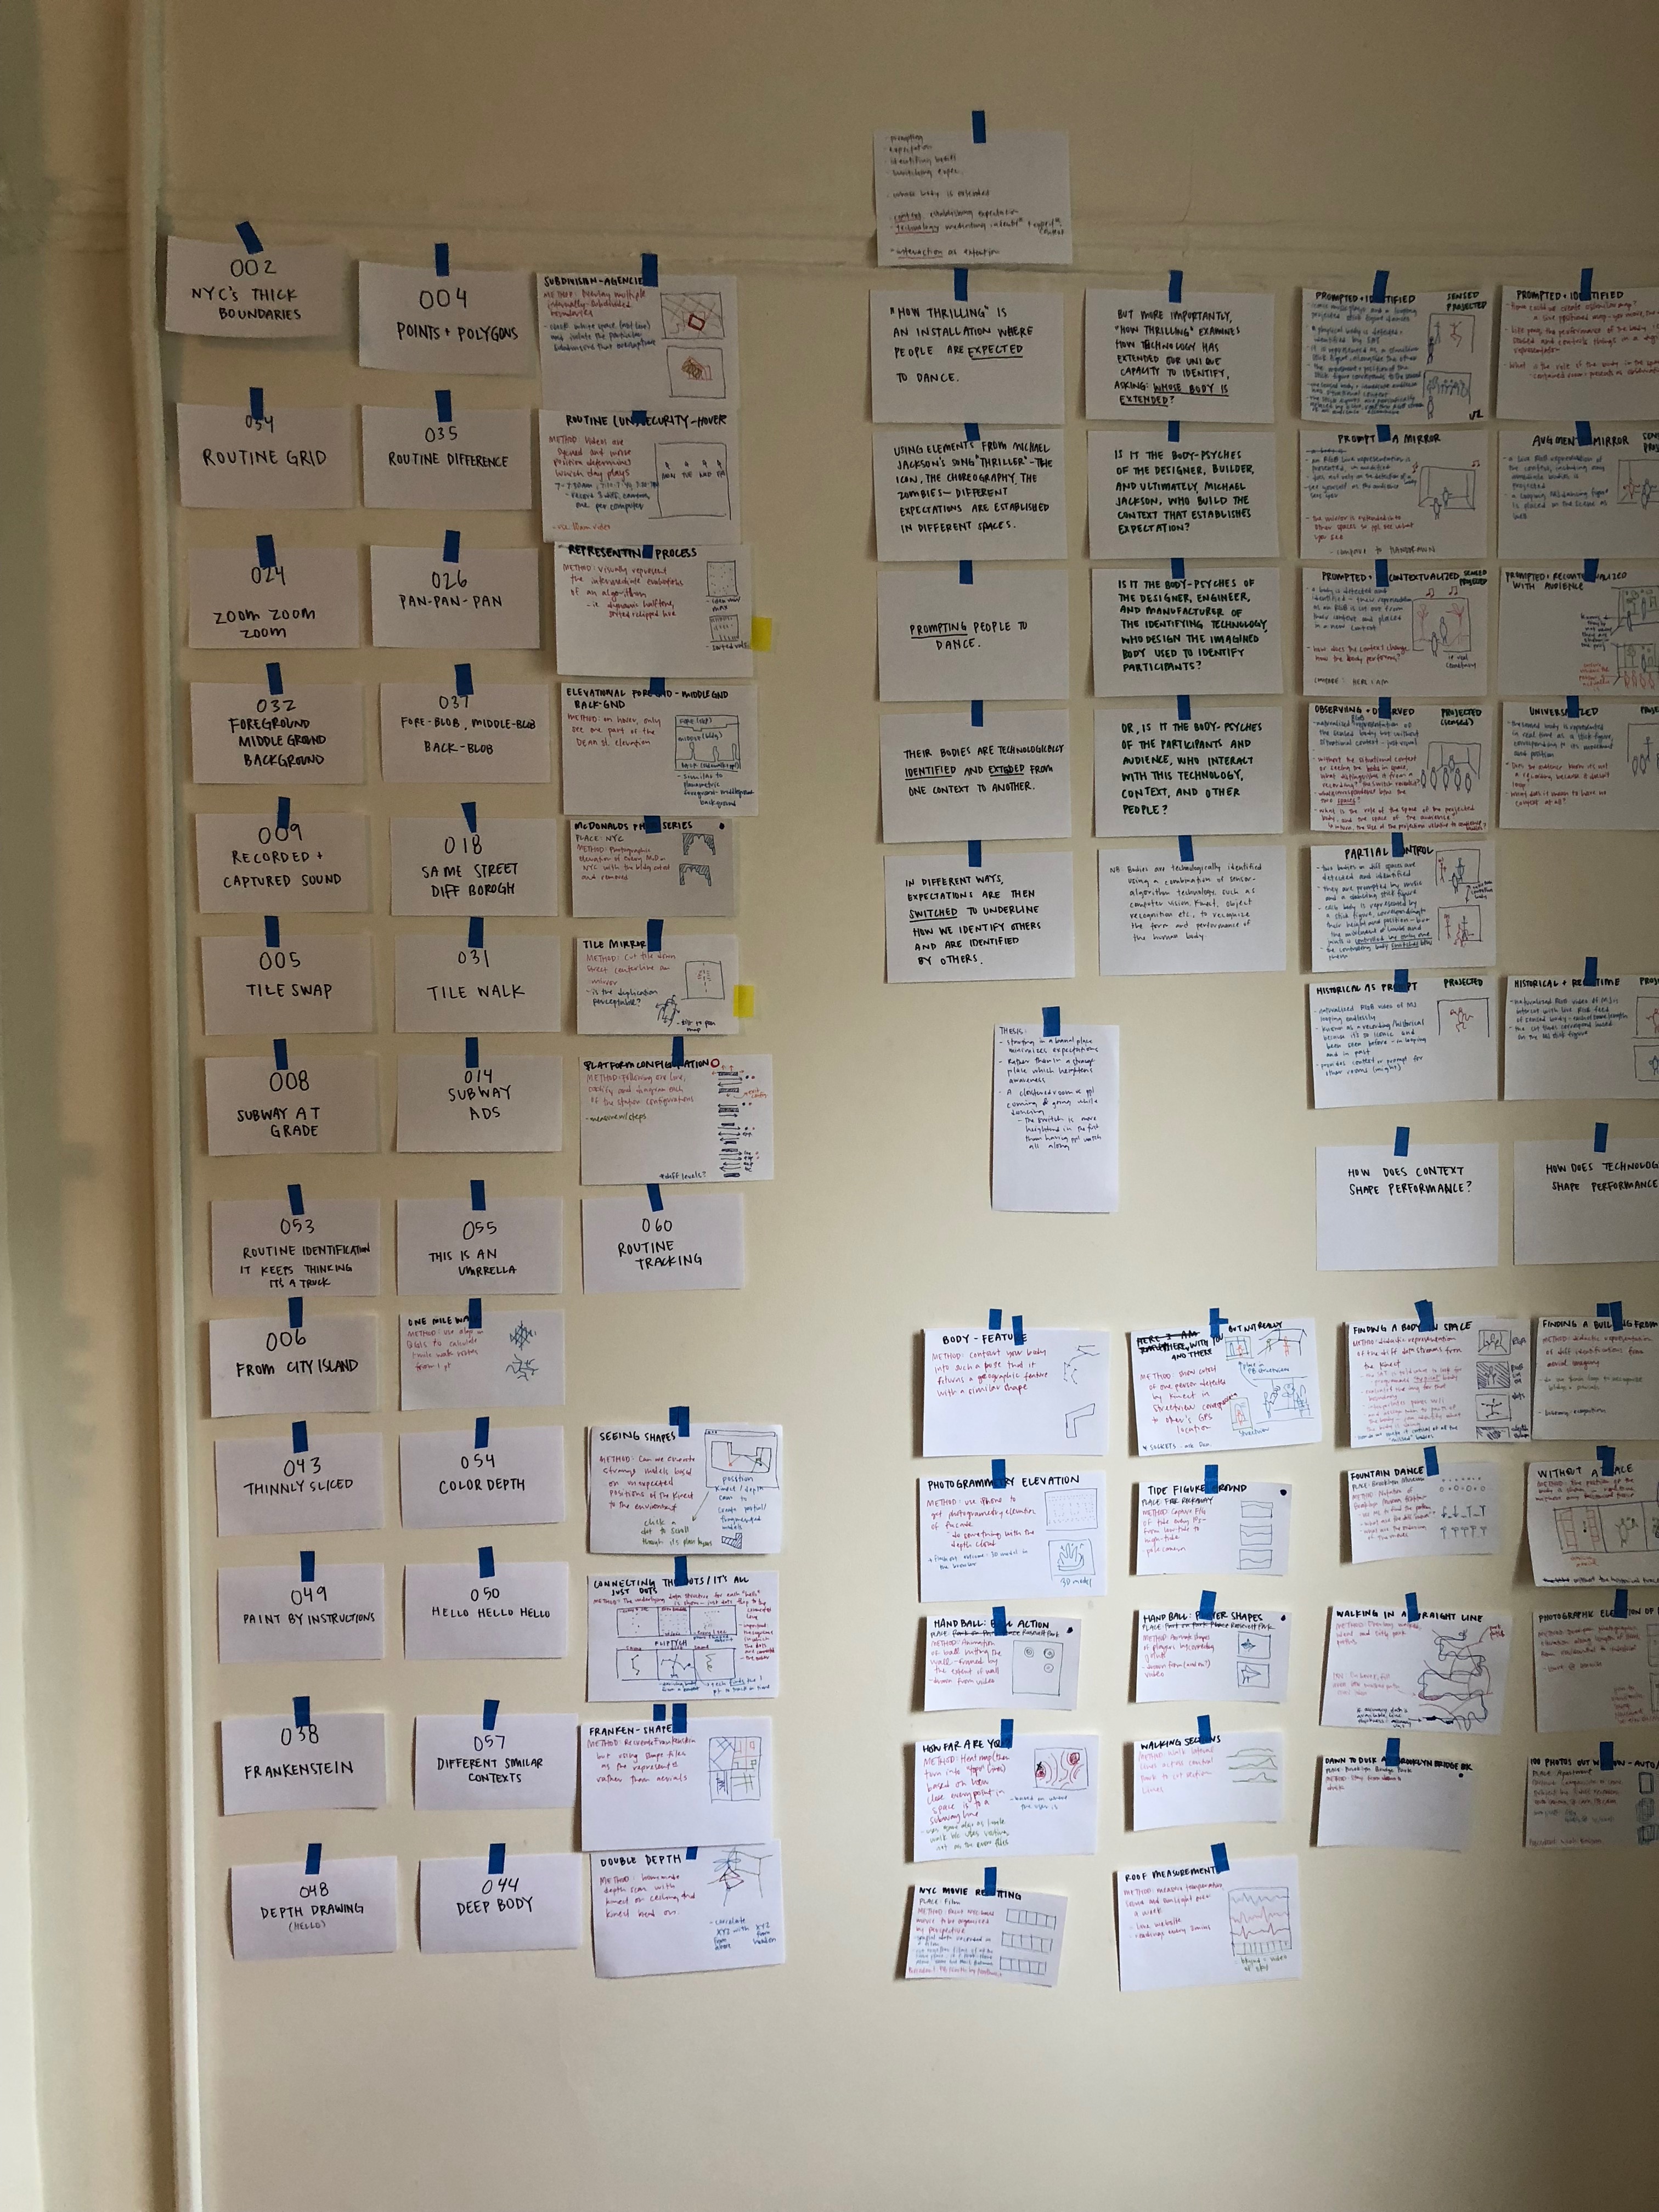
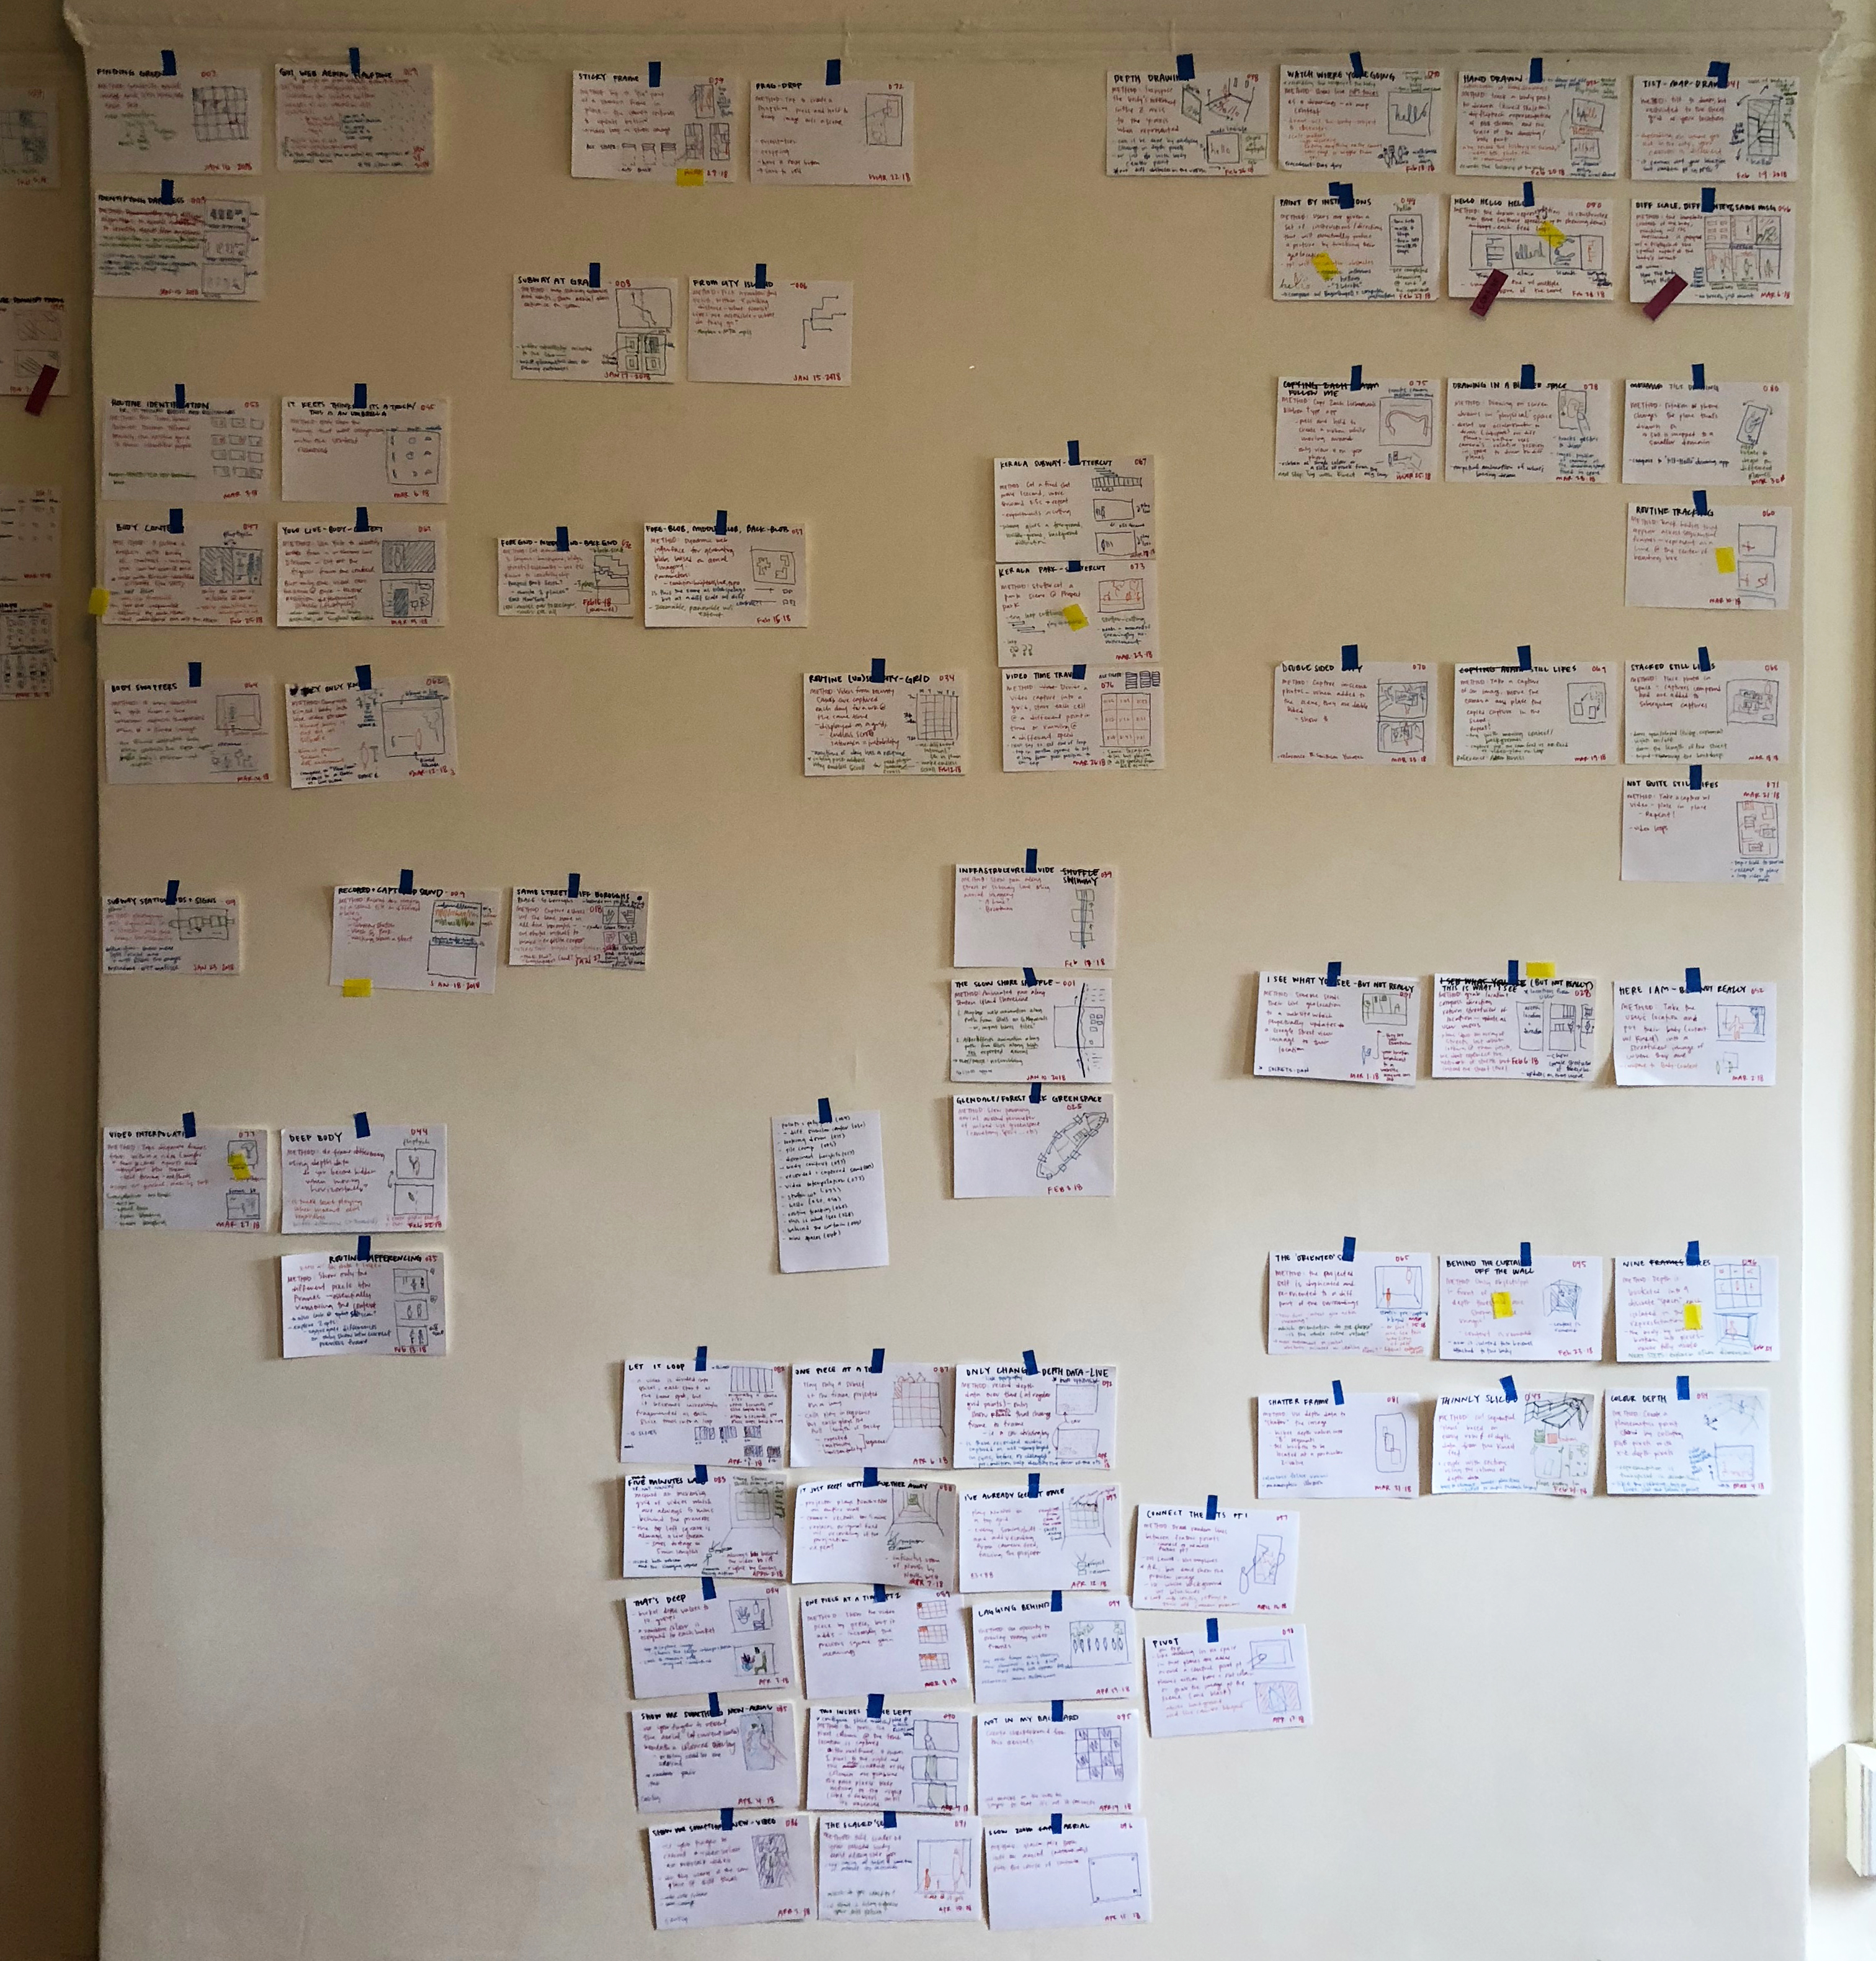
We often work using index cards taped to a wall. They’re large enough to capture a few sentences describing the central question; the interaction; a sketch — maybe a few frames of a storyboard or a rough wireframe; and a descriptive title. On the wall, surrounded by other cards, they’re like thumbnails in a typical ‘grid view’. They form groups with adjacent cards and can move around to form new relationships. For example, “Hand Drawn” (042) is part of the Hello Series, but also relates to other maps exploring the position of the body in space (“The ‘Oriented’ Self,” “Nine Spaces,” “Depth Drawing”). On a big wall, it’s easy to remake these groupings over and over.
However, it isn’t perfect. It’s difficult to return to previous states; you can’t double tap a card to get its ‘expanded’ view; relationships between cards have to be remembered; and it’s difficult for cards to exist in multiple groups simultaneously. What would a digital interface of this wall be like?
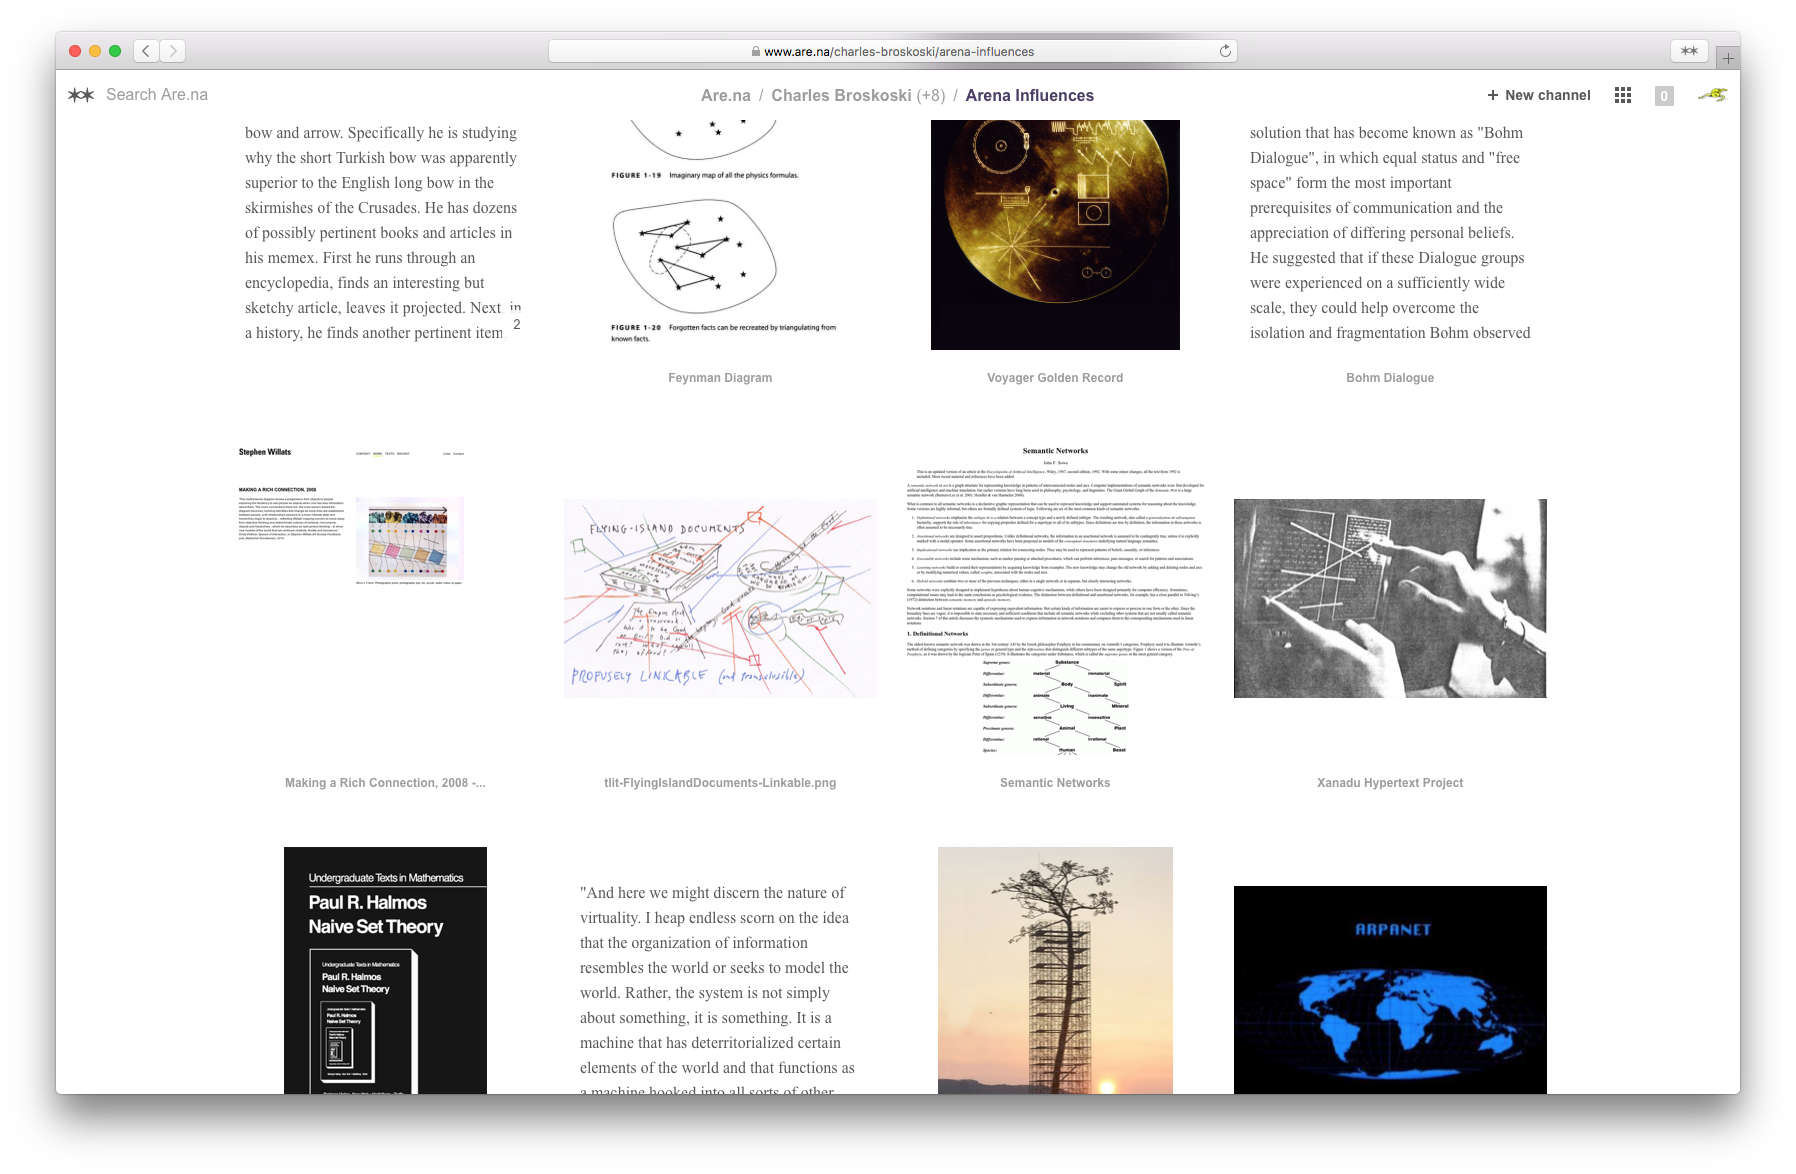
Are.na collection
Pinterest and Are.na serve as precedents for collection interfaces — but really, anything with an overall view coupled with a single-object detail view can serve as an example. However, these precedents don’t address the space and relationships between the whole and the single card. The ‘many’ view and detail view are extremes; there’s a thickness absent between these representations.
Technology creates the potential for objects to have multiple relationships. How can this multiplicity be seen together? Tags and categories are a typical way of identifying relationships, but interfaces tend to isolate them. In a detail view, you might see all the tags for an object, but when navigating to one of those tags, the other associated tags are momentarily forgotten.
Omnigraffle, the diagramming software, and Grasshopper, the parametric plugin for Rhino, also serve as relevant precedents in their grouping and linking functionality.
Known and Strange Places Interface
Using the ‘Known and Strange Places: 100 Maps’ project as a test case, we’re working on an exploratory interface. The ambition is to use it for:
Identifying and describing connections between the parts of a project;
Ordering and organizing those connections;
Viewing and editing connections in isolation as well as in relation to other connections;
Maintaining context at all levels of the interface; and,
Editing materials within a project as it continues to inform other work.
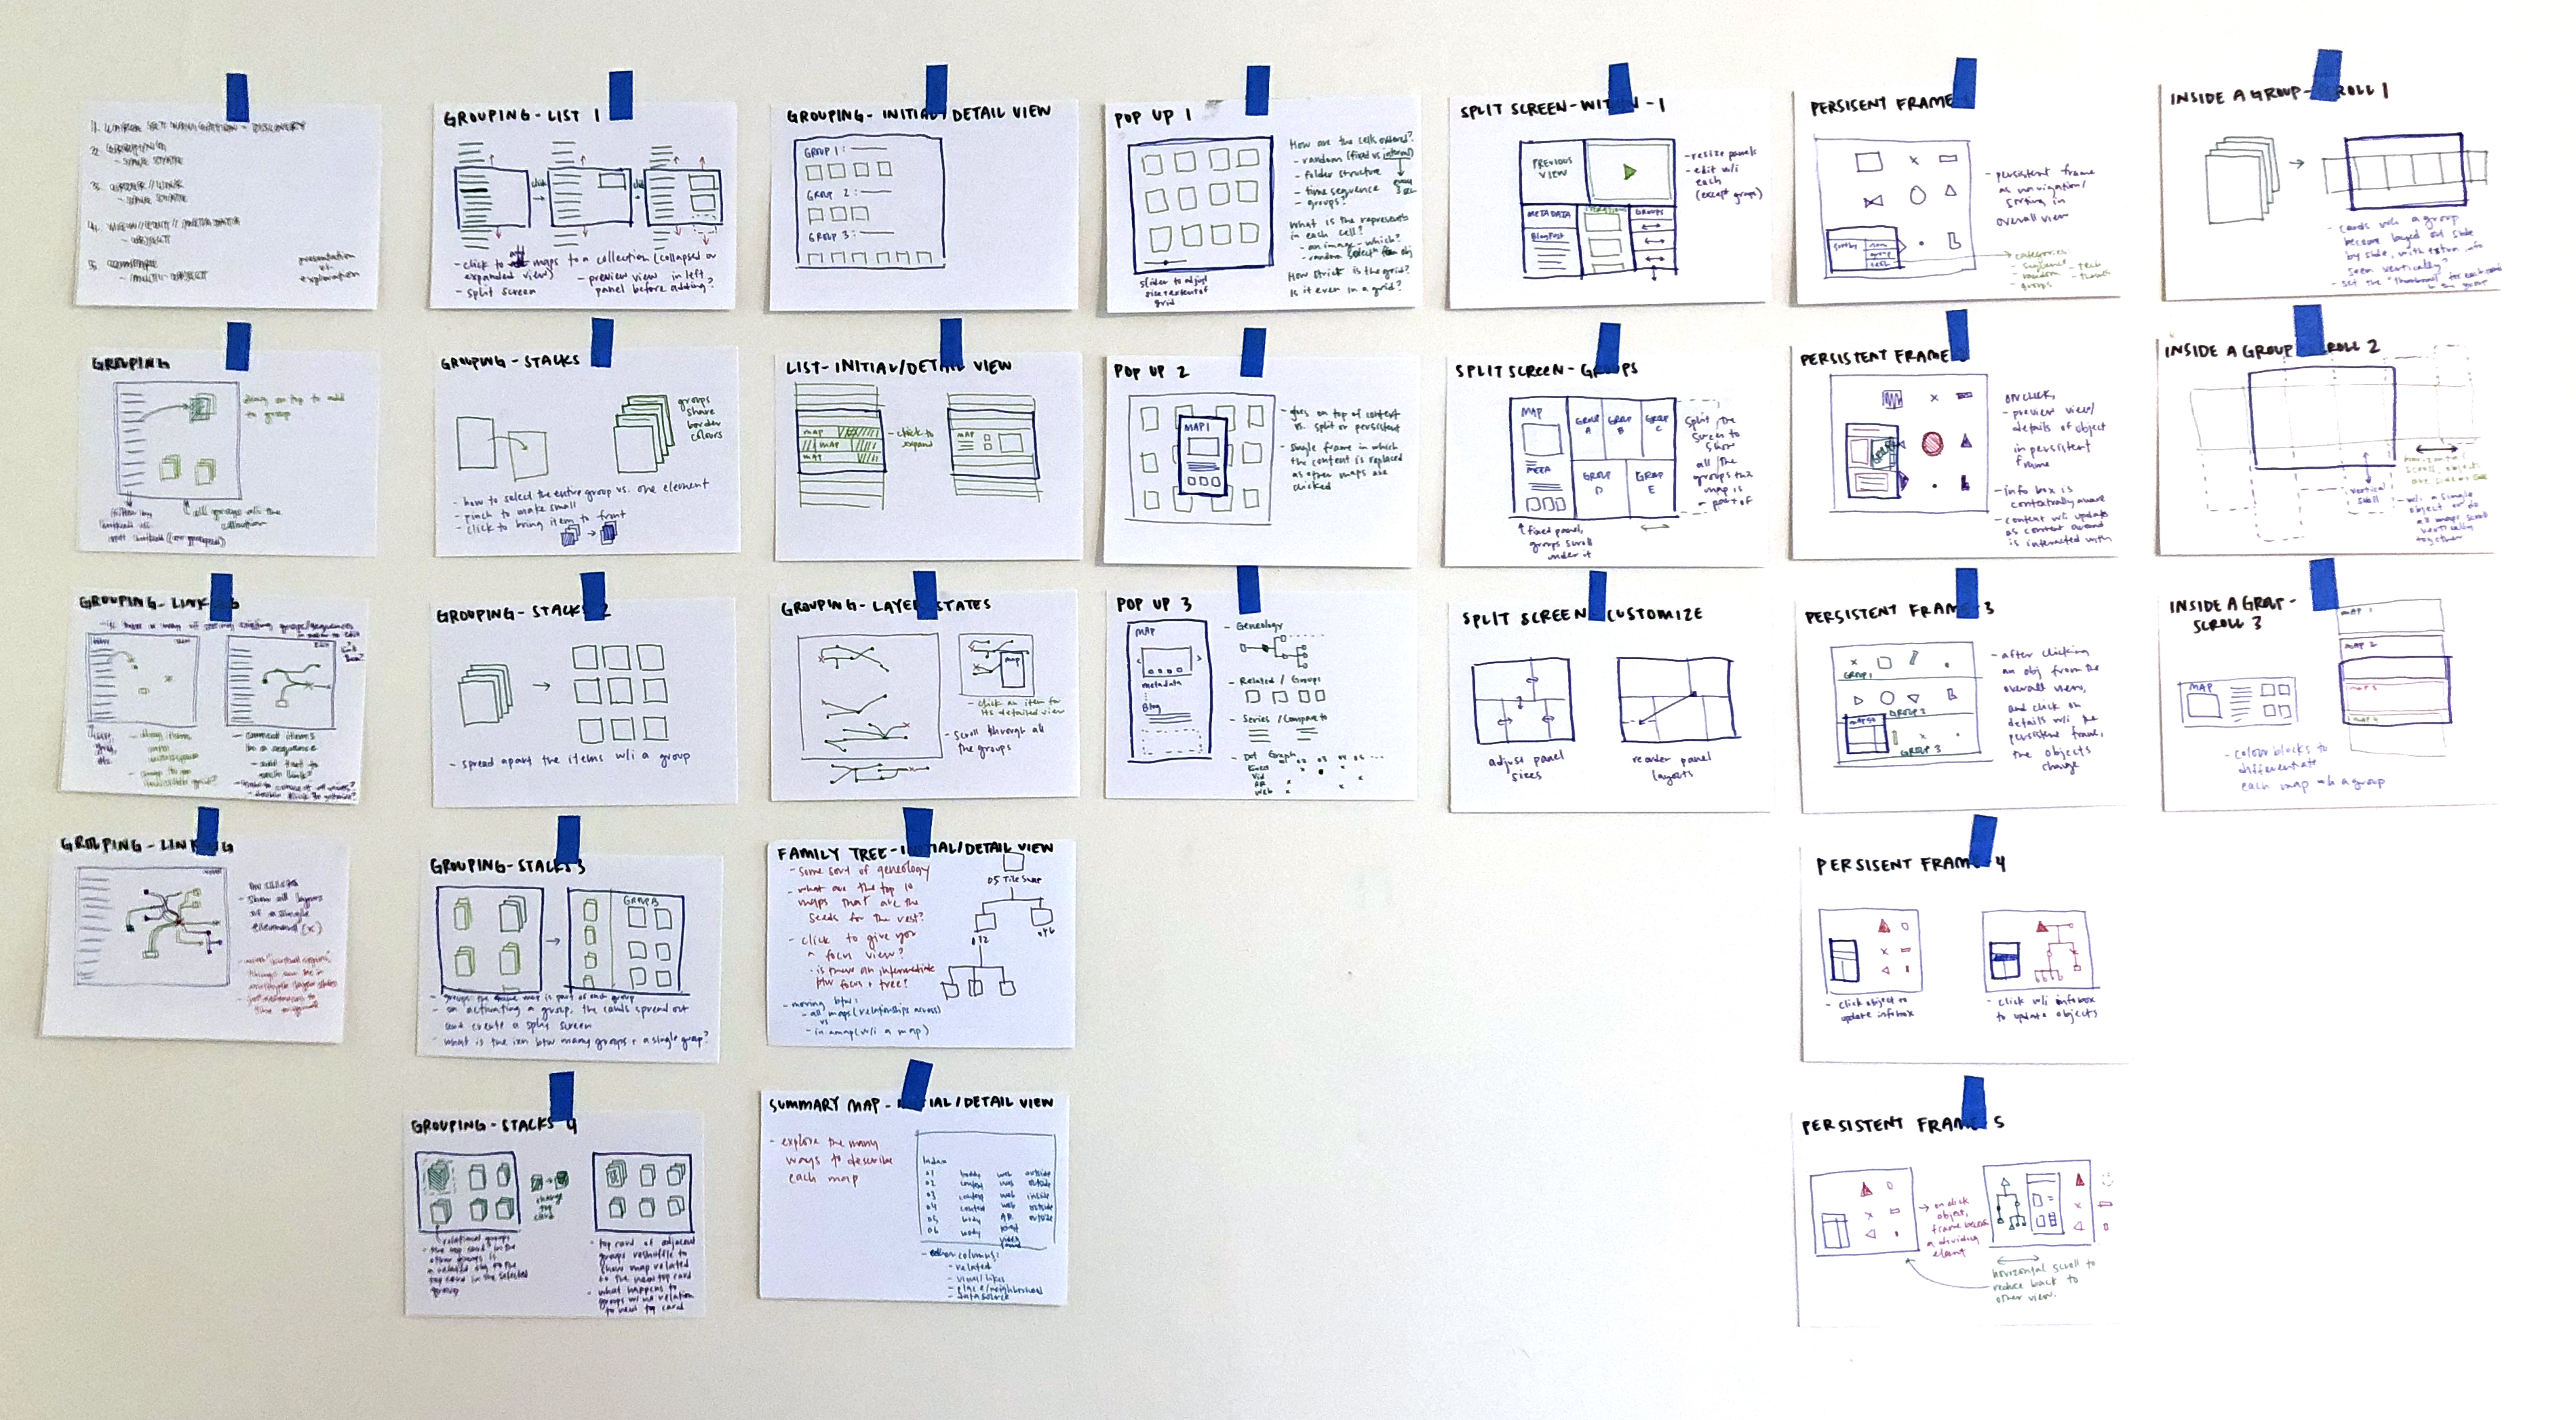
Over the past week, we’ve been sketching ideas and prototyping them in the browser.
Pop Up Details
The first prototype is a Pop-Up detail view. The first attempt falls into the problems described above: an abstracted grid view jumps to a detailed object view. Furthermore, the detail overlay obscures the context.
But, what happens when the details are draggable and moveable so that multiple objects can be seen in detail together?
The next step in this prototype is to add grouping functionality by making stacks with the detail-view objects. When an object-pop-up is dragged and placed on top of another pop-up, they form a group, appearing as stacked cards. The group can be named, reordered and described.
Split-Pop Up
Another iteration split the screen to prevent the obscuring of the context. As more objects were clicked in the grid view, the screen further subdivided.
In further iterations, each detailed aspect of the object was split into a separate panel to show more information associated with each object.
The next steps within this prototype are to allow for adjusting the individual panel sizes, move them around, and allow each panel to show information about a different project. A thumbnail from the grid panel can be dragged into one of the other panes, populating it with the corresponding information. This would allow for associating small aspects of different projects together.
Plans for the Week
The prototypes this past week focused on jumping from an abstracted many-object view to a detailed view. But critical to this interface is the space in-between — making groups and identifying the connections within them; that’s this week’s focus.
From January 10 to April 18th, I had a daily practice of mapmaking. The result is 100 days of known and strange places, or 100 days of interactive web maps, or 100 days of file exports, or 100 days of new walks, or…
The network divides the image into a grid of 13×13 cells, from which five bounding boxes are predicted for each. Consequently, there are potentially 845 (13x13x5) separate bounding boxes.
With each predicted bounding box: a confidence score indicates how certain it is that the box actually encloses some object; and the class is predicted, such as a bicycle, person, dog, etc.
The confidence score and class prediction are combined for a final probability of the bounding box containing a particular classification.
A threshold can be set for the confidence score, which is 0.25 by default. Scores lower than this will not be kept in the final prediction.
YOLO is unique because: predictions are made with a single network evaluation, rather than many incremental regional evaluations; and, as the name suggests, it looks at the image only once, rather than sliding a small window across the image, and classifying many times.
The following links provide more robust explanations of the model:
My life long technology dream has come true: I made a clap-light.
Using the Philips Hue API and accessing a device’s microphone through the browser, a user can toggle a pair of Hue bulbs on and off. Using p5.js, the browser routinely polls the microphone, checking for a sound reading above 0.1. When loud enough, the page makes an AJAX call to change the on/off state. The new state is then saved so it can be toggled.
The full code is available on Github; a snippet below shows the web-interface component.